Skip to content
800-884-8290

|

Login
  • About Us
  • Services
    • Strategic Advisory
    • Margin Management
    • Proprietary Research
    • Brokerage & Insurance
  • Research
    • Dairy
    • Livestock
    • Grain & Oilseeds
    • Ethanol & Biodiesel
  • Account
  • Quotes
  • Contact Us
ABC logo small

Grain & Oilseeds WASDE Update – Jan ’20

  • January 10, 2020
  • by Belinda Przybylski
Corn – U.S. and Global Ending Stocks Above Private Estimates
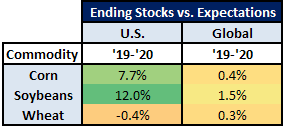
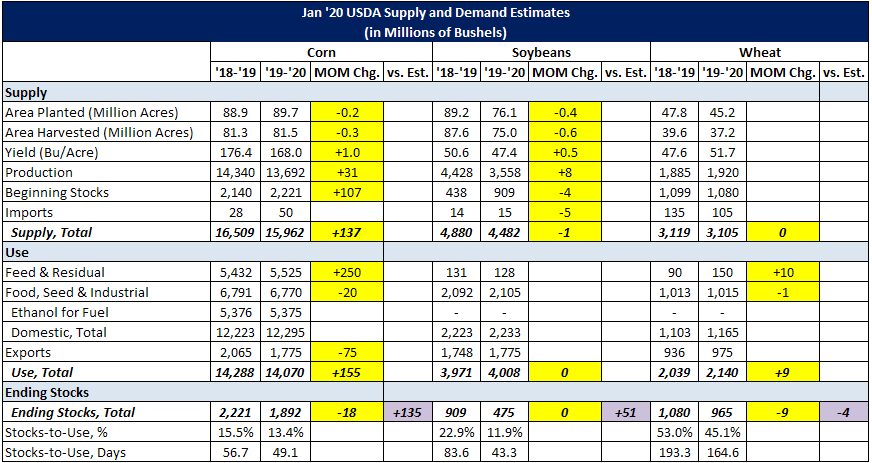
  • ’19-’20 U.S. ending stocks of 1.892 billion bushels significantly above expectations
  • ’19-’20 global ending stocks of 297.8 million MT slightly above expectations
’19-’20 U.S. corn supply projections were raised from the previous month as an increase in yields, coupled with higher beginning stocks, more than offset reduced harvested acres. ’19-’20 U.S. corn demand projections were also raised from the previous month, more than offsetting the projected increase in supply. ’19-’20 projected U.S. corn ending stocks of 1.892 billion bushels, or 49.1 days of use, finished 0.9% below the previous month estimate but remained 7.7% above expectations. The ’19-’20 global corn ending stock projection also finished 0.9% below the previous month estimate but remained 0.4% above expectations. Reductions in global corn ending stock projections were most significant throughout China as production estimates were reduced while feed usage estimates were raised. Soybeans – U.S. and Global Ending Stocks Above Private Estimates
  • ’19-’20 U.S. ending stocks of 475 million bushels significantly above expectations
  • ’19-’20 global ending stocks of 96.7 million MT above expectations
’19-’20 U.S. soybean supply projections were largely unchanged from the previous month while demand projections were unchanged from the previous month. ’19-’20 projected U.S. soybean ending stocks of 475 million bushels, or 43.3 days of use, were unchanged from the previous month but finished 12.0% above expectations. The ’19-’20 global soybean ending stock projection finished 0.3% above the previous month estimate and 1.5% above expectations. Higher projected Brazilian soybean production accounted for the majority of the increase in the global soybean ending stocks projection. ’19-’20 U.S. soybean oil and soybean meal ending stocks were also unchanged from the previous month. Globally, ’19-’20 soybean meal ending stocks were raised from the previous month on higher projected Brazilian production and lower projected Brazilian demand. ’19-’20 global soybean oil ending stocks were raised slightly from the previous month on higher projected Chinese production. Wheat – U.S. and Global Ending Stocks Mixed vs. Private Estimates
  • ’19-’20 U.S. ending stocks of 965 million bushels slightly below expectations
  • ’19-’20 global ending stocks of 288.1 million MT slightly above expectations
’19-’20 U.S. wheat supply projections were unchanged from the previous month while demand projections were raised slightly on higher feed & residual usage. ’19-’20 projected U.S. wheat ending stocks of 965 million bushels, or 164.6 days of use, finished 0.9% below the previous month estimate and 0.4% below expectations. The ’19-’20 global wheat ending stock projection finished 0.5% below the previous month estimate but remained 0.3% above expectations. Higher projected EU-28 wheat exports accounted for the majority of the decline in the global wheat ending stocks projection. Ending Stocks vs. Expectations Summary Overall, ’19-’20 projected U.S. soybean ending stocks finished most significantly above expectations, while U.S. corn stocks and global corn, soybean and wheat stocks also finished above expectations. Domestic wheat ending stocks finished slightly below expectations.  
Dairy
Ethanol
Livestock
Grain

Recent Grain & Oilseeds Research

  • USDA Weekly Crop Export Sales – 10/20/2022
  • Crop Progress Update – 08/07/22
  • Crop Progress Update – 07/29/22
  • USDA Ukraine Wheat Harvest Update
  • U.S. Acreage Update – Jun ’22
Atten Babler Risk Management LLC
11406 US Route 20 W
Galena, IL 61036
800-884-8290
Atten Babler Risk Management LLC use sources that they believe to be reliable, but they cannot warrant the accuracy of any of the data included in this site. Opinions and market data are subject to change at any time. Unless otherwise stated the information contained herein is meant for informational purposes only and is not a solicitation to enter into any transaction.
© Copyright 2025 Atten Babler Risk Management LLC