U.S. Livestock & Meat Trade Update – Oct ’16
Executive Summary
U.S. livestock and meat trade figures provided by USDA were recently updated with values spanning through Aug ’16. Highlights from the updated report include:
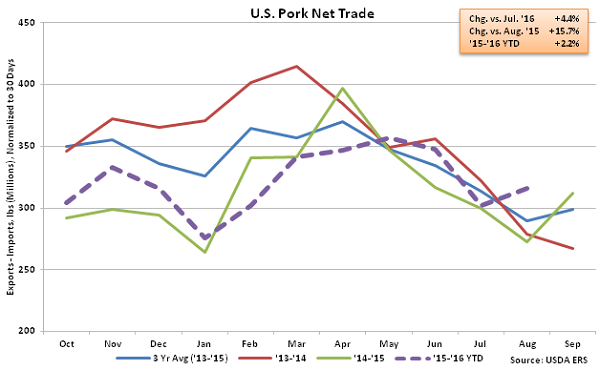
• Net pork trade increased on a YOY basis for the fourth consecutive month during Aug ’16, finishing up 15.7%.
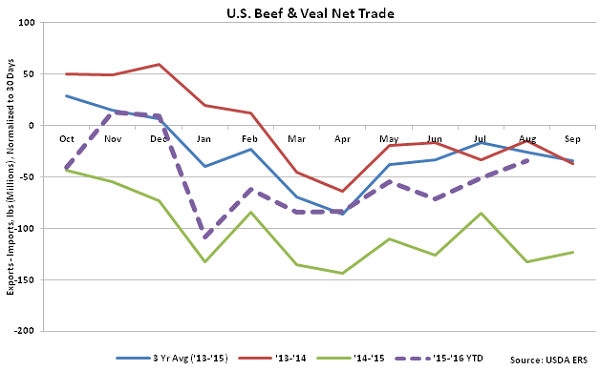
• Net beef & veal trade remained negative for the eighth consecutive month during Aug ’16, despite import volumes declining on a YOY basis for the 11th consecutive month.
• Net broiler trade increased on a YOY basis for the second consecutive month during Aug ’16, finishing 17.6% above the previous year.
Additional Report Details
Pork – Net Trade Finishes Higher on a YOY Basis for the Fourth Consecutive Month
According to USDA, Aug ’16 U.S. pork export volumes increased 3.2% MOM on a daily average basis while remaining higher on a YOY basis for the fourth consecutive month, finishing up 11.4%. Of the major export destinations, YOY increases in export volumes were widespread and led by shipments to South Korea (+36.7%), followed by shipments to Japan (+23.1%), combined shipments to Hong Kong, Taiwan and China (+12.9%), shipments to Mexico (+5.2%) and shipments to Canada (+1.1%). U.S. pork export volumes destined to the aforementioned countries accounted for over 85% of all pork export volumes during Aug ’16.
U.S. pork import volumes finished lower on a YOY basis during Aug ’16, declining by 2.0%. The increase in pork export volumes, coupled with the decline in import volumes, resulted in Aug ’16 U.S. net pork trade finishing up 15.7% YOY. The YOY increase in net pork trade was the largest experienced throughout the past 11 months on a percentage basis. Net pork trade has increased on a YOY basis for four consecutive months through August. ’14-’15 annual net pork trade finished down 10.7% to a new five year low, however ’15-’16 net pork trade has rebounded by 2.2% YOY throughout the first 11 months of the production season.
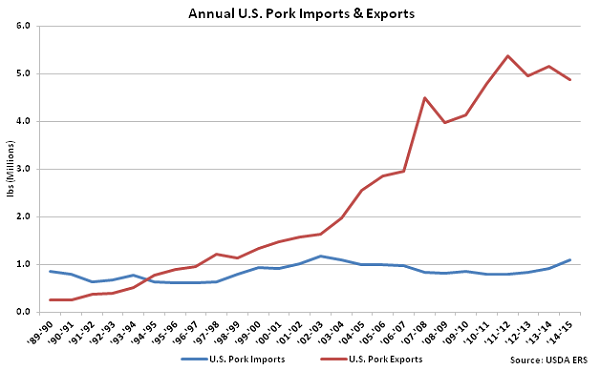
 U.S. pork export volumes have strengthened considerably over the past ten years, increasing by a compound annual growth rate (CAGR) of 3.7%, while U.S. pork imports have remained fairly flat, increasing by a CAGR of 0.9% over the same time period. ’14-’15 annual pork imports experienced much stronger growth, finishing 18.2% higher than the previous year, the largest YOY percentage gain experienced in the past 16 years. ’14-’15 annual pork exports volumes remained over four times as large as import volumes, despite declining to a four year low on an absolute basis.
 Beef & Veal – Net Trade Remains Negative for the Eighth Consecutive Month
According to USDA, Aug ’16 U.S. beef & veal export volumes increased 5.5% MOM on a daily average basis and 29.5% YOY, finishing at a two year high. Of the major export destinations, YOY increases in export volumes were led by shipments destined to South Korea (+70.4%), followed by shipments destined to Japan (+43.1%), combined shipments to Hong Kong, Taiwan and China (+30.6%) and shipments destined to Mexico (+30.3%). The YOY increases more than offset a decline in export volumes destined to Canada (-14.3%). U.S. beef & veal export volumes destined to the aforementioned countries accounted for over 85% of all beef & veal export volumes during Aug ’16.
Aug ’16 U.S. beef & veal import volumes remained lower on a YOY basis for the 11th consecutive month, finishing down 16.0%. Despite the YOY declines, beef & veal import volumes continue to exceed export volumes, resulting in Aug ’16 net beef & veal trade remaining negative for the eighth consecutive month.
Beef & Veal – Net Trade Remains Negative for the Eighth Consecutive Month
According to USDA, Aug ’16 U.S. beef & veal export volumes increased 5.5% MOM on a daily average basis and 29.5% YOY, finishing at a two year high. Of the major export destinations, YOY increases in export volumes were led by shipments destined to South Korea (+70.4%), followed by shipments destined to Japan (+43.1%), combined shipments to Hong Kong, Taiwan and China (+30.6%) and shipments destined to Mexico (+30.3%). The YOY increases more than offset a decline in export volumes destined to Canada (-14.3%). U.S. beef & veal export volumes destined to the aforementioned countries accounted for over 85% of all beef & veal export volumes during Aug ’16.
Aug ’16 U.S. beef & veal import volumes remained lower on a YOY basis for the 11th consecutive month, finishing down 16.0%. Despite the YOY declines, beef & veal import volumes continue to exceed export volumes, resulting in Aug ’16 net beef & veal trade remaining negative for the eighth consecutive month.
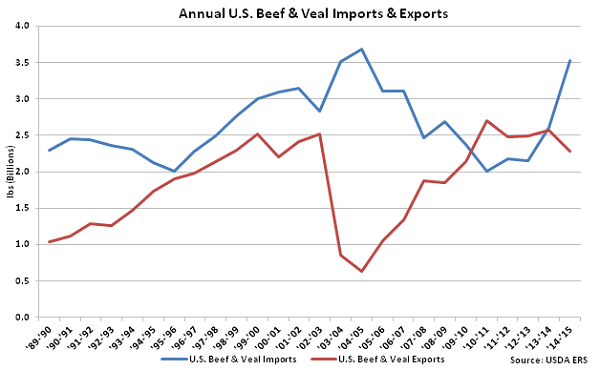
 ’14-’15 annual U.S. beef & veal imports finished higher than annual U.S. beef & veal exports for the second consecutive year as annual import volumes increased to a ten year high and export volumes declined to a five year low. Overall, net beef & veal trade reached an eight low year during the ’14-’15 production season.
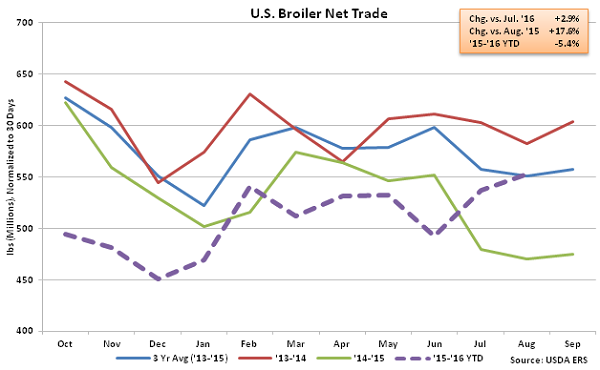
 Chicken –Net Broiler Trade Increases on a YOY Basis for the Second Consecutive Month
Aug ’16 U.S. broiler export volumes increased 2.8% MOM on a daily average basis while also finishing higher on a YOY basis for the second consecutive month, increasing by 16.7%. Of the major export destinations, YOY increases in broiler export volumes were led by combined shipments destined to Hong Kong, Taiwan and China (+60.9%), although broiler export volumes destined to Canada (-19.4%) and Mexico (-0.5%) declined for the third consecutive month.
U.S. broiler import volumes declined on a YOY basis for the third consecutive month during Aug ’16, finishing down 18.4%. Broiler import volumes remain at insignificant levels relative to export volumes, with Aug ’16 imports amounting to less than 2.0% of export volumes. The YOY increase in broiler export volumes, coupled with the YOY decline in import volumes, resulted in U.S. broiler net trade finishing up 17.6% YOY during Aug ’16. The YOY increase in net broiler trade was the largest experienced throughout the past four years on a percentage basis. Net broiler trade declined 10.9% throughout the ’14-’15 production season and remains down an additional 5.4% throughout the first 11 months of the ’15-’16 production season, despite the most recent YOY gains.
Chicken –Net Broiler Trade Increases on a YOY Basis for the Second Consecutive Month
Aug ’16 U.S. broiler export volumes increased 2.8% MOM on a daily average basis while also finishing higher on a YOY basis for the second consecutive month, increasing by 16.7%. Of the major export destinations, YOY increases in broiler export volumes were led by combined shipments destined to Hong Kong, Taiwan and China (+60.9%), although broiler export volumes destined to Canada (-19.4%) and Mexico (-0.5%) declined for the third consecutive month.
U.S. broiler import volumes declined on a YOY basis for the third consecutive month during Aug ’16, finishing down 18.4%. Broiler import volumes remain at insignificant levels relative to export volumes, with Aug ’16 imports amounting to less than 2.0% of export volumes. The YOY increase in broiler export volumes, coupled with the YOY decline in import volumes, resulted in U.S. broiler net trade finishing up 17.6% YOY during Aug ’16. The YOY increase in net broiler trade was the largest experienced throughout the past four years on a percentage basis. Net broiler trade declined 10.9% throughout the ’14-’15 production season and remains down an additional 5.4% throughout the first 11 months of the ’15-’16 production season, despite the most recent YOY gains.
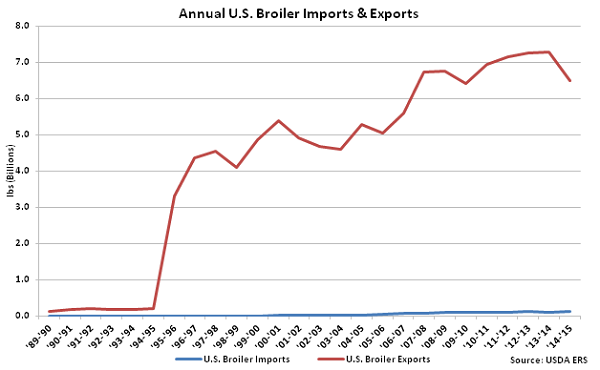
 U.S. broiler import volumes have increased by a CAGR of 11.7% over the past ten years, larger than the 2.1% CAGR in broiler export volumes experienced over the same period. U.S. broiler import volumes remain significantly lower than export volumes on an absolute basis, however, as ’14-’15 annual broiler exports volumes finished over 50 times as large as import volumes throughout the year. Broiler export volumes remain significantly higher than import volumes despite declining to a five year low on an absolute basis throughout the ’14-’15 production season.
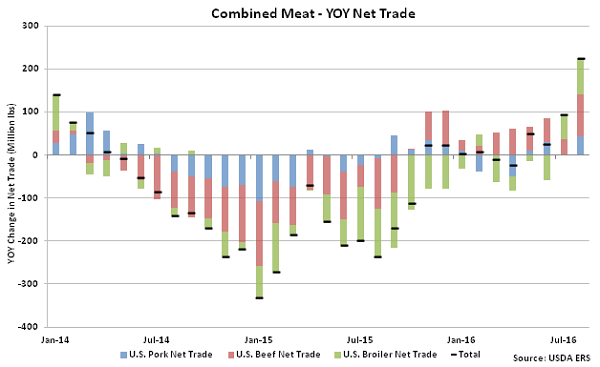
 Combined net trade of U.S. pork, beef and broilers increased on a YOY basis for the eighth time in the past ten months during Aug ’16. The Aug ’16 YOY increase in combined net trade of pork, beef and broilers reached a five year high on a percentage basis. Combined net trade of pork, beef and broilers had declined over 18 consecutive months from May ’14 – Oct ’15 and finished down 21.5% YOY throughout the ’14-’15 production season.
U.S. pork export volumes have strengthened considerably over the past ten years, increasing by a compound annual growth rate (CAGR) of 3.7%, while U.S. pork imports have remained fairly flat, increasing by a CAGR of 0.9% over the same time period. ’14-’15 annual pork imports experienced much stronger growth, finishing 18.2% higher than the previous year, the largest YOY percentage gain experienced in the past 16 years. ’14-’15 annual pork exports volumes remained over four times as large as import volumes, despite declining to a four year low on an absolute basis.
Beef & Veal – Net Trade Remains Negative for the Eighth Consecutive Month
According to USDA, Aug ’16 U.S. beef & veal export volumes increased 5.5% MOM on a daily average basis and 29.5% YOY, finishing at a two year high. Of the major export destinations, YOY increases in export volumes were led by shipments destined to South Korea (+70.4%), followed by shipments destined to Japan (+43.1%), combined shipments to Hong Kong, Taiwan and China (+30.6%) and shipments destined to Mexico (+30.3%). The YOY increases more than offset a decline in export volumes destined to Canada (-14.3%). U.S. beef & veal export volumes destined to the aforementioned countries accounted for over 85% of all beef & veal export volumes during Aug ’16.
Aug ’16 U.S. beef & veal import volumes remained lower on a YOY basis for the 11th consecutive month, finishing down 16.0%. Despite the YOY declines, beef & veal import volumes continue to exceed export volumes, resulting in Aug ’16 net beef & veal trade remaining negative for the eighth consecutive month.
’14-’15 annual U.S. beef & veal imports finished higher than annual U.S. beef & veal exports for the second consecutive year as annual import volumes increased to a ten year high and export volumes declined to a five year low. Overall, net beef & veal trade reached an eight low year during the ’14-’15 production season.
Chicken –Net Broiler Trade Increases on a YOY Basis for the Second Consecutive Month
Aug ’16 U.S. broiler export volumes increased 2.8% MOM on a daily average basis while also finishing higher on a YOY basis for the second consecutive month, increasing by 16.7%. Of the major export destinations, YOY increases in broiler export volumes were led by combined shipments destined to Hong Kong, Taiwan and China (+60.9%), although broiler export volumes destined to Canada (-19.4%) and Mexico (-0.5%) declined for the third consecutive month.
U.S. broiler import volumes declined on a YOY basis for the third consecutive month during Aug ’16, finishing down 18.4%. Broiler import volumes remain at insignificant levels relative to export volumes, with Aug ’16 imports amounting to less than 2.0% of export volumes. The YOY increase in broiler export volumes, coupled with the YOY decline in import volumes, resulted in U.S. broiler net trade finishing up 17.6% YOY during Aug ’16. The YOY increase in net broiler trade was the largest experienced throughout the past four years on a percentage basis. Net broiler trade declined 10.9% throughout the ’14-’15 production season and remains down an additional 5.4% throughout the first 11 months of the ’15-’16 production season, despite the most recent YOY gains.
U.S. broiler import volumes have increased by a CAGR of 11.7% over the past ten years, larger than the 2.1% CAGR in broiler export volumes experienced over the same period. U.S. broiler import volumes remain significantly lower than export volumes on an absolute basis, however, as ’14-’15 annual broiler exports volumes finished over 50 times as large as import volumes throughout the year. Broiler export volumes remain significantly higher than import volumes despite declining to a five year low on an absolute basis throughout the ’14-’15 production season.
Combined net trade of U.S. pork, beef and broilers increased on a YOY basis for the eighth time in the past ten months during Aug ’16. The Aug ’16 YOY increase in combined net trade of pork, beef and broilers reached a five year high on a percentage basis. Combined net trade of pork, beef and broilers had declined over 18 consecutive months from May ’14 – Oct ’15 and finished down 21.5% YOY throughout the ’14-’15 production season.