U.S. Livestock Cold Storage Update – Mar ’16
Executive Summary
U.S. cold storage figures provided by USDA were recently updated with values spanning through Feb ’16. Highlights from the updated report include:
• Feb ’16 U.S. pork and beef stocks declined YOY for the first time in 12 and 14 months, respectively, but remained within ten percent of historical maximum storage levels for the month of February.
• Feb ’16 U.S. chicken stocks remained higher on a YOY basis for the 15th consecutive month, finishing up 10.7%.
• Combined U.S. pork, beef and chicken stocks declined 2.0% from the monthly record high experienced during Jan ’16 but finished at a record high seasonal level for the month of February.
Additional Report Details
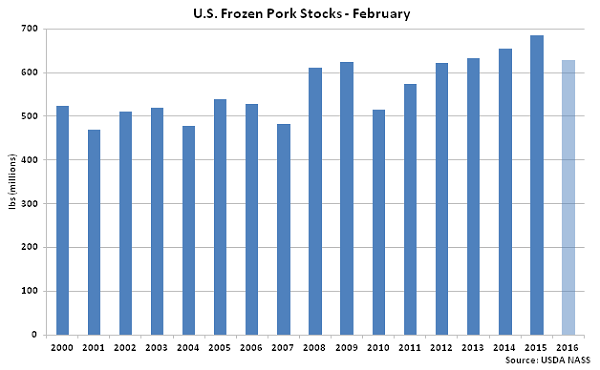
Pork – Stocks Finish at Four Year Low for the Month of February
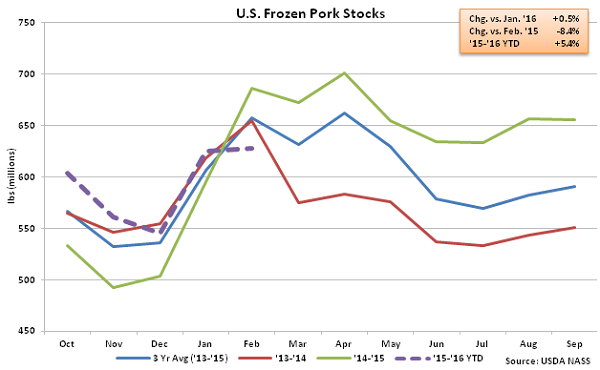 According to USDA, Feb ’16 U.S. frozen pork stocks of 628.4 million pounds increased 0.5% MOM to a new five month high but finished 8.4% below the previous year’s record February stock levels. Pork stocks had increased YOY for 12 consecutive months prior to the most recent YOY decline. The MOM increase of 3.1 million pounds, or 0.5%, was significantly less than the ten year average January – February seasonal increase in stocks of 30.4 million pounds, or 5.2%. The lower than average MOM increase was also off of a January stocks level that was revised lower by 11.8 million pounds, or 1.9%, from the initial estimate last month. Feb ’16 pork stocks declined to a four year low for the month of February, finishing 4.5% below the previous three year average February pork stocks.
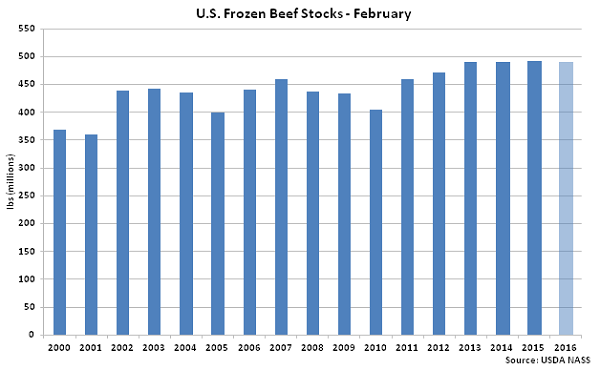
 Beef – Stocks Decline on YOY Basis for the First Time in 15 Months
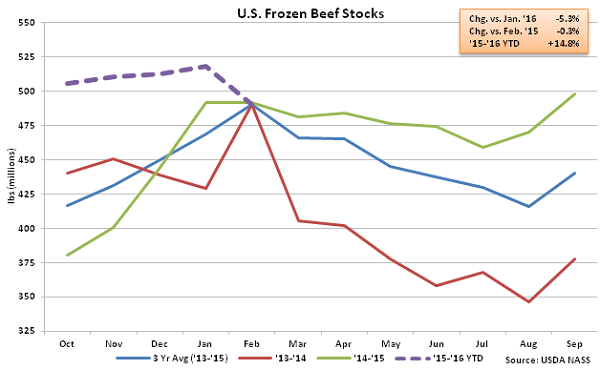 Jan ’16 U.S. frozen beef stocks of 490.6 million pounds declined 5.3% MOM and 0.3% YOY from the nine year high experienced during Jan ’16. Beef stocks had increased YOY for 14 consecutive months prior to the most recent YOY decline. The MOM decline in beef stocks of 27.6 million pounds, or 5.3%, was significantly larger than the ten year average January – February decline in beef stocks of 5.1 million pounds, or 1.0%. Feb ’16 beef stocks finished equal to the three year average February beef stocks.
 Chicken – Stocks Finish at a Ten Year High for the Month of February, up 10.7% YOY
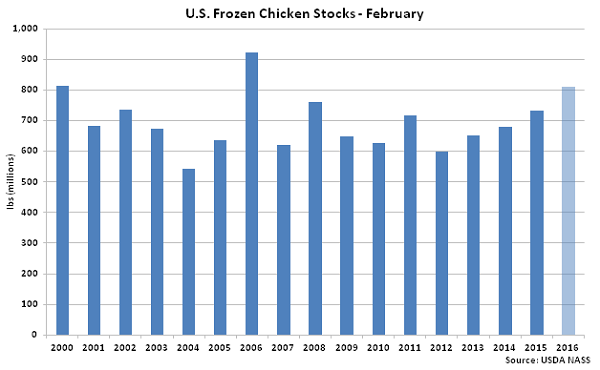
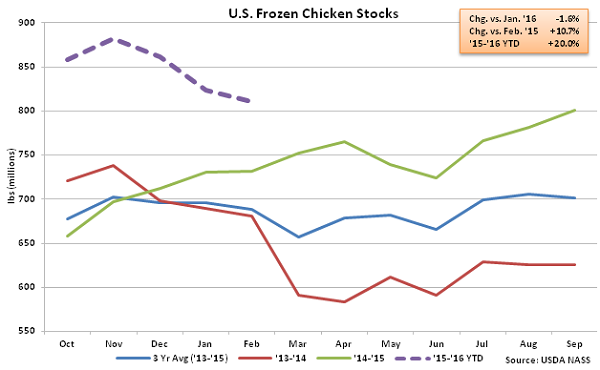 Feb ’16 U.S. frozen chicken stocks of 810.4 million pounds declined 1.6% MOM but remained 10.7% higher YOY, finishing at a ten year high for the month of February. Chicken stocks increased YOY for the 15th month in a row after nine consecutive months of YOY declines were experienced from Mar ’14 – Nov ’14. The MOM decrease in chicken stocks of 13.2 million pounds, or 1.6%, was smaller than the ten year average January – February seasonal decline in stocks of 20.0 million pounds, or 2.8%. Stocks have built as the Russian import ban continues to negatively affect U.S. broiler exports. U.S. broiler export volumes have declined by 10.7% YOY since the ban was announced. Feb ’16 chicken stocks finished 17.7% higher than the three year average February chicken stocks.
 Overall, combined Feb ’16 U.S. pork, beef and chicken stocks declined 2.0% from the monthly record high experienced in Jan ’16. Individually, Feb ’16 U.S. pork, beef and chicken stocks each finished within 15% of historical maximum storage levels.
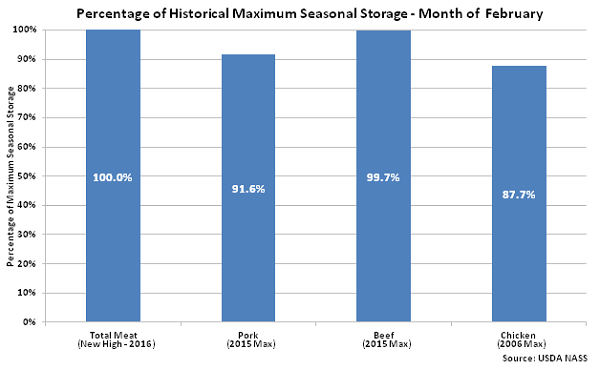
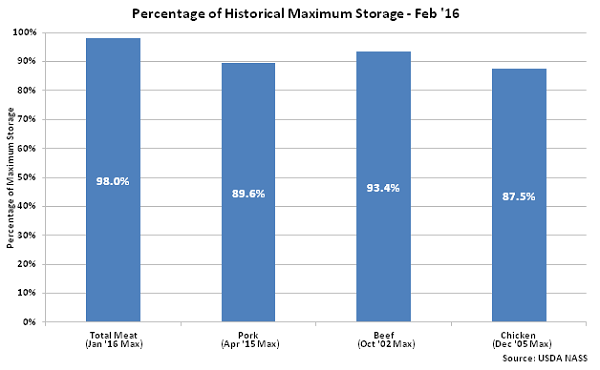 Feb ’16 combined U.S. pork, beef and chicken stocks reached a new record high storage level for the month of February. Beef stocks were within one percent of a record high seasonal storage level while pork and chicken stocks each finished within 15% of historical February maximum storage levels.
According to USDA, Feb ’16 U.S. frozen pork stocks of 628.4 million pounds increased 0.5% MOM to a new five month high but finished 8.4% below the previous year’s record February stock levels. Pork stocks had increased YOY for 12 consecutive months prior to the most recent YOY decline. The MOM increase of 3.1 million pounds, or 0.5%, was significantly less than the ten year average January – February seasonal increase in stocks of 30.4 million pounds, or 5.2%. The lower than average MOM increase was also off of a January stocks level that was revised lower by 11.8 million pounds, or 1.9%, from the initial estimate last month. Feb ’16 pork stocks declined to a four year low for the month of February, finishing 4.5% below the previous three year average February pork stocks.
Beef – Stocks Decline on YOY Basis for the First Time in 15 Months
Jan ’16 U.S. frozen beef stocks of 490.6 million pounds declined 5.3% MOM and 0.3% YOY from the nine year high experienced during Jan ’16. Beef stocks had increased YOY for 14 consecutive months prior to the most recent YOY decline. The MOM decline in beef stocks of 27.6 million pounds, or 5.3%, was significantly larger than the ten year average January – February decline in beef stocks of 5.1 million pounds, or 1.0%. Feb ’16 beef stocks finished equal to the three year average February beef stocks.
Chicken – Stocks Finish at a Ten Year High for the Month of February, up 10.7% YOY
Feb ’16 U.S. frozen chicken stocks of 810.4 million pounds declined 1.6% MOM but remained 10.7% higher YOY, finishing at a ten year high for the month of February. Chicken stocks increased YOY for the 15th month in a row after nine consecutive months of YOY declines were experienced from Mar ’14 – Nov ’14. The MOM decrease in chicken stocks of 13.2 million pounds, or 1.6%, was smaller than the ten year average January – February seasonal decline in stocks of 20.0 million pounds, or 2.8%. Stocks have built as the Russian import ban continues to negatively affect U.S. broiler exports. U.S. broiler export volumes have declined by 10.7% YOY since the ban was announced. Feb ’16 chicken stocks finished 17.7% higher than the three year average February chicken stocks.
Overall, combined Feb ’16 U.S. pork, beef and chicken stocks declined 2.0% from the monthly record high experienced in Jan ’16. Individually, Feb ’16 U.S. pork, beef and chicken stocks each finished within 15% of historical maximum storage levels.
Feb ’16 combined U.S. pork, beef and chicken stocks reached a new record high storage level for the month of February. Beef stocks were within one percent of a record high seasonal storage level while pork and chicken stocks each finished within 15% of historical February maximum storage levels.