U.S. Dairy Product Production Update – Sep ’19
Executive Summary
U.S. dairy product production figures provided by USDA were recently updated with values spanning through Jul ’19. Highlights from the updated report include:
 Cheese – Production Remains at a Record High Seasonal Level, Finishes up 0.5% YOY
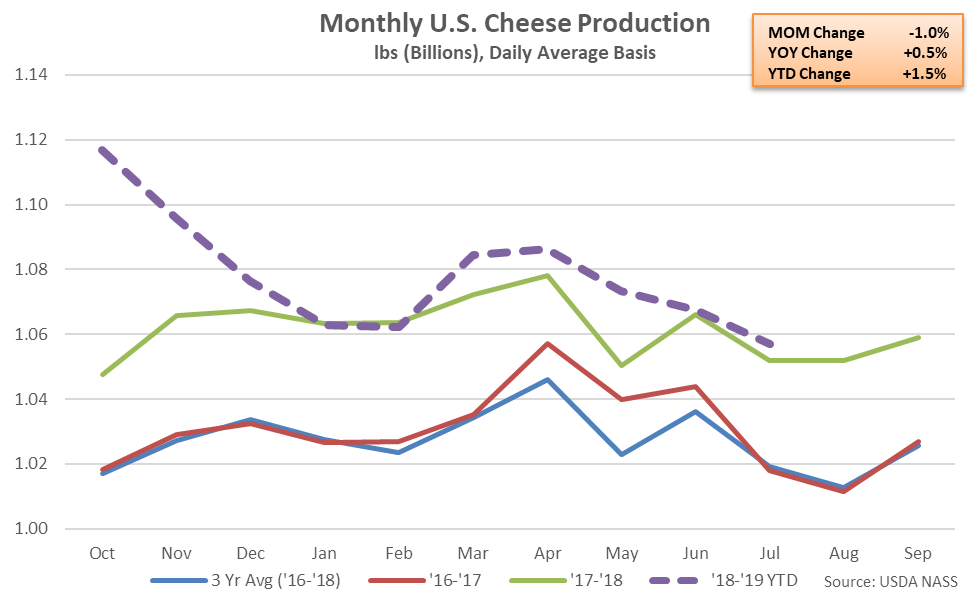
Jul ’19 total U.S. cheese production increased 0.5% YOY, reaching a record high seasonal level for the month of July. The YOY increase in cheese production was the fifth experienced in a row. Jul ’19 Atlantic and Central U.S. cheese production increased 2.7% and 0.4%, respectively, on a YOY basis throughout the month, more than offsetting a 0.1% YOY decline in Western U.S. cheese production. Other-than-cheddar cheese production increased 3.0% on a YOY basis throughout the month, more than offsetting a 5.5% YOY decline in cheddar cheese production. ’17-’18 annual cheese production increased 3.0% YOY to a record annual high as cheddar cheese production finished 2.7% higher and other-than-cheddar cheese increased 3.1%. ’18-’19 YTD cheese production has increased an additional 1.5% YOY throughout the first ten months of the production season, driven higher by a 2.6% increase in other-than-cheddar production.
Cheese – Production Remains at a Record High Seasonal Level, Finishes up 0.5% YOY
Jul ’19 total U.S. cheese production increased 0.5% YOY, reaching a record high seasonal level for the month of July. The YOY increase in cheese production was the fifth experienced in a row. Jul ’19 Atlantic and Central U.S. cheese production increased 2.7% and 0.4%, respectively, on a YOY basis throughout the month, more than offsetting a 0.1% YOY decline in Western U.S. cheese production. Other-than-cheddar cheese production increased 3.0% on a YOY basis throughout the month, more than offsetting a 5.5% YOY decline in cheddar cheese production. ’17-’18 annual cheese production increased 3.0% YOY to a record annual high as cheddar cheese production finished 2.7% higher and other-than-cheddar cheese increased 3.1%. ’18-’19 YTD cheese production has increased an additional 1.5% YOY throughout the first ten months of the production season, driven higher by a 2.6% increase in other-than-cheddar production.
 Dry Whey – Production Declines YOY for the 13th Time in the Past 14 Months, Finishes Down 8.9%
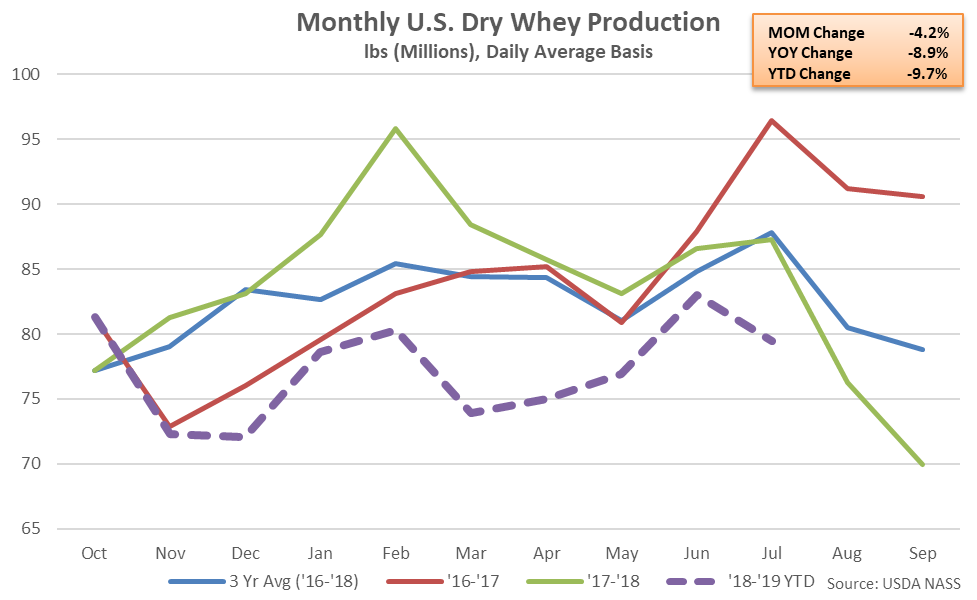
Jul ’19 U.S. dry whey production declined 8.9% YOY, finishing lower on a YOY basis for the 13th time in the past 14 months and reaching a four year seasonal low level. Jul ’19 YOY declines in dry whey production experienced throughout the Western U.S. (-25.7%) and Central U.S. (-4.0%) more than offset a 5.1% YOY increase in Atlantic U.S. production experienced throughout the month. In addition to the decline in dry whey production, combined whey protein concentrate (WPC) and whey protein isolate (WPI) production declined 3.1% on a YOY basis throughout Jul ‘19, finishing lower on a YOY basis for the sixth consecutive month. Overall, combined dry whey, WPC and WPI production declined 6.8% YOY throughout Jul ’19, finishing lower on a YOY basis for the ninth consecutive month. ’17-’18 annual dry whey production declined 0.7% YOY however combined production of dry whey, WPC and WPI finished up 1.3%. ’18-’19 YTD dry whey production has declined an additional 9.7% YOY throughout the first ten months of the production season, while combined production of dry whey, WPC and WPI has declined 6.8%.
Dry Whey – Production Declines YOY for the 13th Time in the Past 14 Months, Finishes Down 8.9%
Jul ’19 U.S. dry whey production declined 8.9% YOY, finishing lower on a YOY basis for the 13th time in the past 14 months and reaching a four year seasonal low level. Jul ’19 YOY declines in dry whey production experienced throughout the Western U.S. (-25.7%) and Central U.S. (-4.0%) more than offset a 5.1% YOY increase in Atlantic U.S. production experienced throughout the month. In addition to the decline in dry whey production, combined whey protein concentrate (WPC) and whey protein isolate (WPI) production declined 3.1% on a YOY basis throughout Jul ‘19, finishing lower on a YOY basis for the sixth consecutive month. Overall, combined dry whey, WPC and WPI production declined 6.8% YOY throughout Jul ’19, finishing lower on a YOY basis for the ninth consecutive month. ’17-’18 annual dry whey production declined 0.7% YOY however combined production of dry whey, WPC and WPI finished up 1.3%. ’18-’19 YTD dry whey production has declined an additional 9.7% YOY throughout the first ten months of the production season, while combined production of dry whey, WPC and WPI has declined 6.8%.
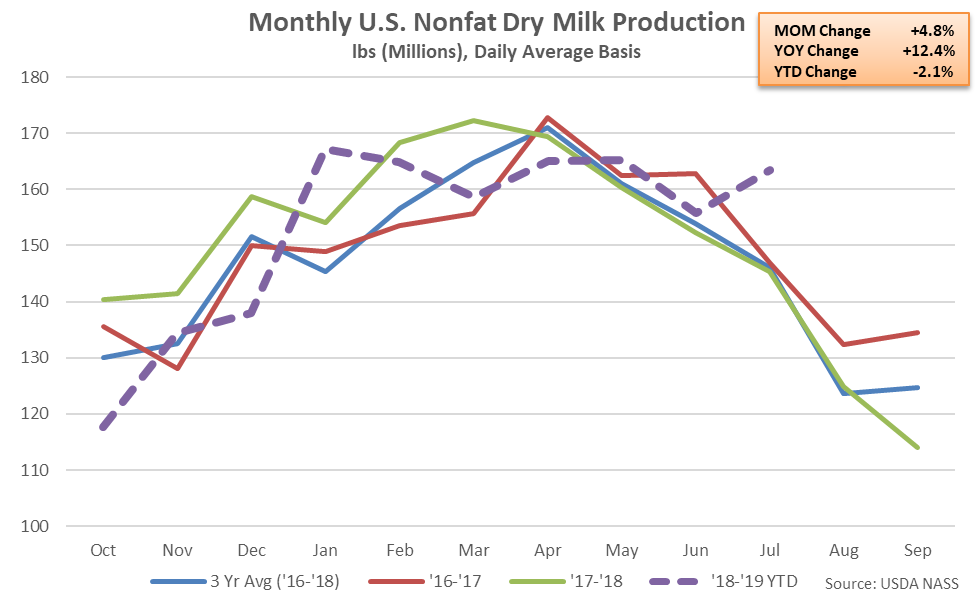
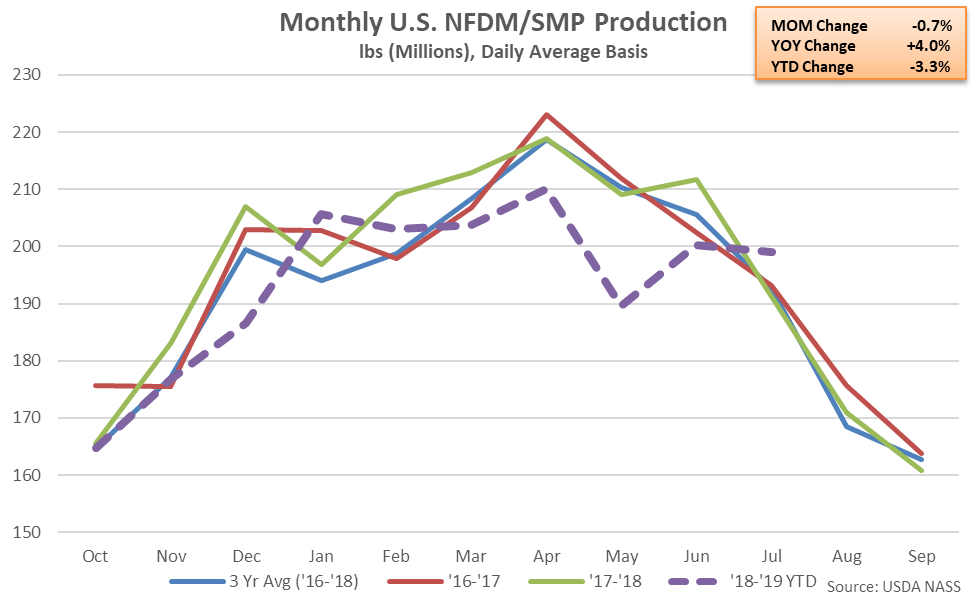
 NFDM/SMP – Combined Production Higher YOY for the First Time in Six Months, Finishes up 4.0%
Jul ’19 U.S. nonfat dry milk (NFDM) production increased 12.4% YOY, finishing higher for the third consecutive month. Jul ’19 YOY increases in Western U.S. (+22.5%) and Central U.S. (+6.3) nonfat dry milk production more than offset a 7.8% YOY decline in Atlantic U.S. production experienced throughout the month. Production of skim milk powder (SMP), which is more suited to the requirements of most global markets, finished lower on a YOY basis for the sixth time in the past seven months during Jul ’19, however, declining by 22.7%. The Jul ’19 YOY increase in NFDM production more than offset the YOY decline in SMP production, resulting in Jul ’19 combined production of NFDM and SMP increasing 4.0% throughout the month, finishing higher for the first time in the past six months. ’17-’18 annual combined production of NFDM and SMP increased 0.2% to a record high annual level however ’18-’19 YTD combined production of NFDM and SMP has declined 3.3% YOY throughout the first ten months of the production season, despite the most recent YOY increase.
NFDM/SMP – Combined Production Higher YOY for the First Time in Six Months, Finishes up 4.0%
Jul ’19 U.S. nonfat dry milk (NFDM) production increased 12.4% YOY, finishing higher for the third consecutive month. Jul ’19 YOY increases in Western U.S. (+22.5%) and Central U.S. (+6.3) nonfat dry milk production more than offset a 7.8% YOY decline in Atlantic U.S. production experienced throughout the month. Production of skim milk powder (SMP), which is more suited to the requirements of most global markets, finished lower on a YOY basis for the sixth time in the past seven months during Jul ’19, however, declining by 22.7%. The Jul ’19 YOY increase in NFDM production more than offset the YOY decline in SMP production, resulting in Jul ’19 combined production of NFDM and SMP increasing 4.0% throughout the month, finishing higher for the first time in the past six months. ’17-’18 annual combined production of NFDM and SMP increased 0.2% to a record high annual level however ’18-’19 YTD combined production of NFDM and SMP has declined 3.3% YOY throughout the first ten months of the production season, despite the most recent YOY increase.
 Overall, skim milk powder production declined most significantly YOY on a percentage basis during Jul ’19, followed by dry whey production, while nonfat dry milk and butter experienced the largest YOY increases in production throughout the month.
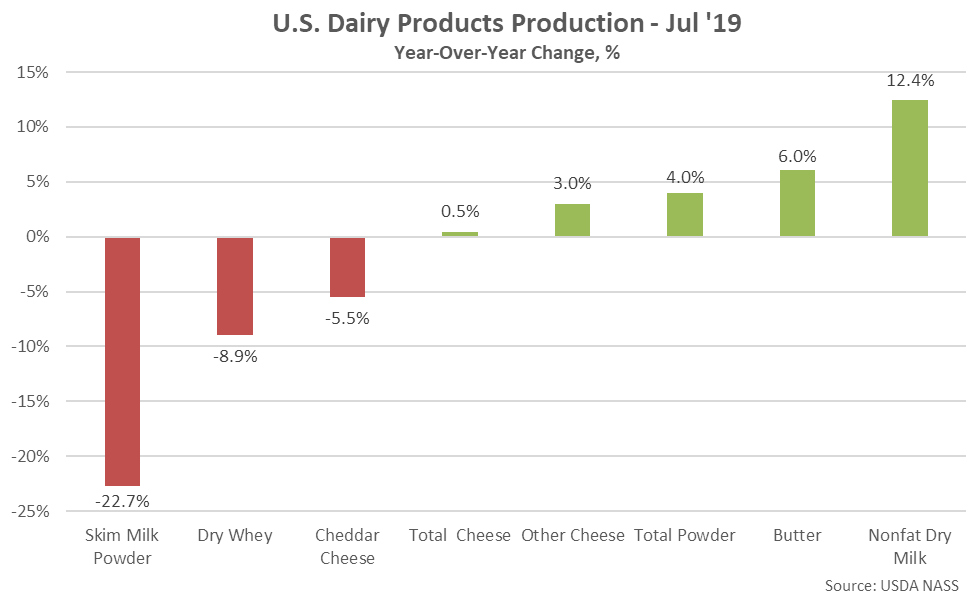
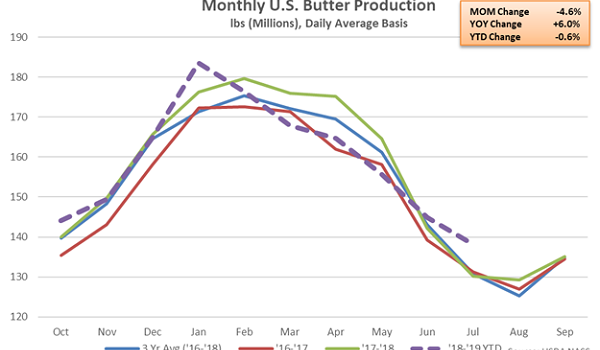
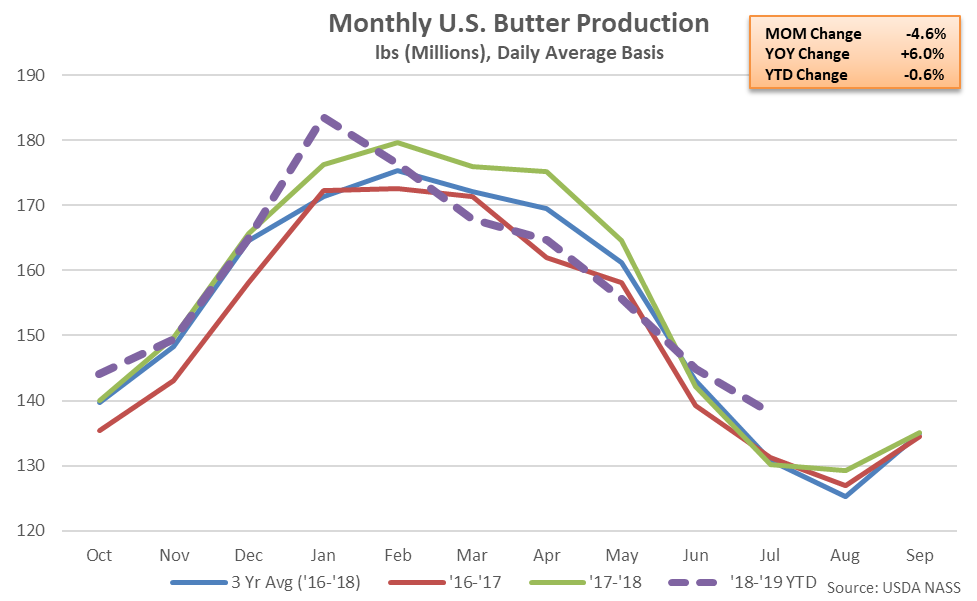
- Jul ’19 U.S. butter production increased on a YOY basis for the second consecutive month, finishing up 6.0% and reaching a record high seasonal level.
- Jul ’19 U.S. cheese production increased 0.5% YOY to a record high seasonal level however U.S. dry whey production remained lower on a YOY basis for the 13th time in the past 14 months, finishing down 8.9% to a four year seasonal low level.
- Jul ’19 combined production of U.S. nonfat dry milk and skim milk powder increased 4.0% on a YOY basis, finishing higher for the first time in the past six months. Nonfat dry milk production increased 12.4% YOY throughout the month, more than offsetting a 22.7% YOY decline in skim milk powder production.
Cheese – Production Remains at a Record High Seasonal Level, Finishes up 0.5% YOY
Jul ’19 total U.S. cheese production increased 0.5% YOY, reaching a record high seasonal level for the month of July. The YOY increase in cheese production was the fifth experienced in a row. Jul ’19 Atlantic and Central U.S. cheese production increased 2.7% and 0.4%, respectively, on a YOY basis throughout the month, more than offsetting a 0.1% YOY decline in Western U.S. cheese production. Other-than-cheddar cheese production increased 3.0% on a YOY basis throughout the month, more than offsetting a 5.5% YOY decline in cheddar cheese production. ’17-’18 annual cheese production increased 3.0% YOY to a record annual high as cheddar cheese production finished 2.7% higher and other-than-cheddar cheese increased 3.1%. ’18-’19 YTD cheese production has increased an additional 1.5% YOY throughout the first ten months of the production season, driven higher by a 2.6% increase in other-than-cheddar production.
Dry Whey – Production Declines YOY for the 13th Time in the Past 14 Months, Finishes Down 8.9%
Jul ’19 U.S. dry whey production declined 8.9% YOY, finishing lower on a YOY basis for the 13th time in the past 14 months and reaching a four year seasonal low level. Jul ’19 YOY declines in dry whey production experienced throughout the Western U.S. (-25.7%) and Central U.S. (-4.0%) more than offset a 5.1% YOY increase in Atlantic U.S. production experienced throughout the month. In addition to the decline in dry whey production, combined whey protein concentrate (WPC) and whey protein isolate (WPI) production declined 3.1% on a YOY basis throughout Jul ‘19, finishing lower on a YOY basis for the sixth consecutive month. Overall, combined dry whey, WPC and WPI production declined 6.8% YOY throughout Jul ’19, finishing lower on a YOY basis for the ninth consecutive month. ’17-’18 annual dry whey production declined 0.7% YOY however combined production of dry whey, WPC and WPI finished up 1.3%. ’18-’19 YTD dry whey production has declined an additional 9.7% YOY throughout the first ten months of the production season, while combined production of dry whey, WPC and WPI has declined 6.8%.
NFDM/SMP – Combined Production Higher YOY for the First Time in Six Months, Finishes up 4.0%
Jul ’19 U.S. nonfat dry milk (NFDM) production increased 12.4% YOY, finishing higher for the third consecutive month. Jul ’19 YOY increases in Western U.S. (+22.5%) and Central U.S. (+6.3) nonfat dry milk production more than offset a 7.8% YOY decline in Atlantic U.S. production experienced throughout the month. Production of skim milk powder (SMP), which is more suited to the requirements of most global markets, finished lower on a YOY basis for the sixth time in the past seven months during Jul ’19, however, declining by 22.7%. The Jul ’19 YOY increase in NFDM production more than offset the YOY decline in SMP production, resulting in Jul ’19 combined production of NFDM and SMP increasing 4.0% throughout the month, finishing higher for the first time in the past six months. ’17-’18 annual combined production of NFDM and SMP increased 0.2% to a record high annual level however ’18-’19 YTD combined production of NFDM and SMP has declined 3.3% YOY throughout the first ten months of the production season, despite the most recent YOY increase.
Overall, skim milk powder production declined most significantly YOY on a percentage basis during Jul ’19, followed by dry whey production, while nonfat dry milk and butter experienced the largest YOY increases in production throughout the month.