Soybean Complex Crushing & Stocks Update – Feb ’22
Executive Summary
U.S. soybean crush and stocks figures provided by the USDA were recently updated with values spanning through Dec ’21. Highlights from the updated report include:
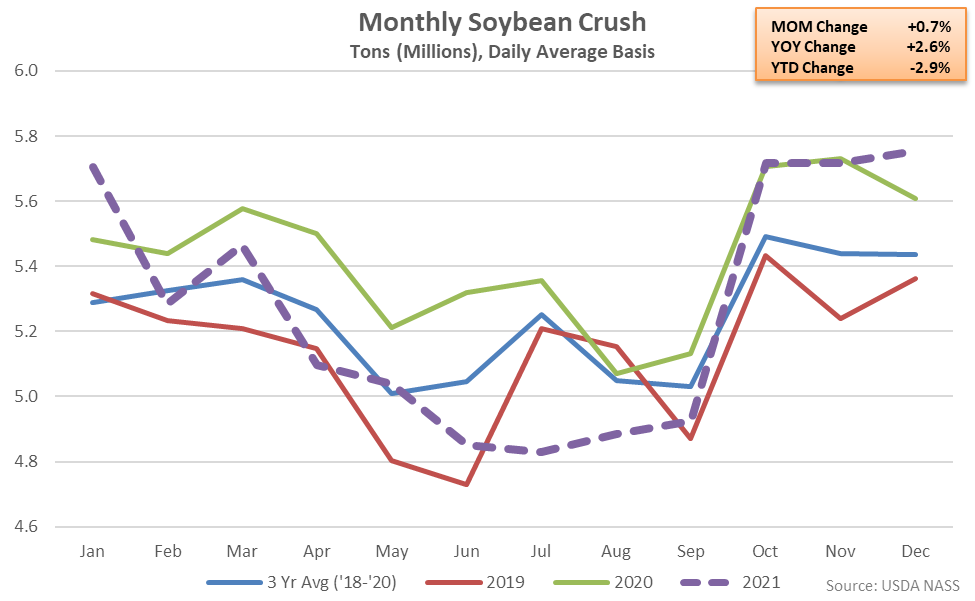
- U.S. soybean crushings increased 2.6% on a YOY basis throughout Dec ’21, reaching a record high monthly level.
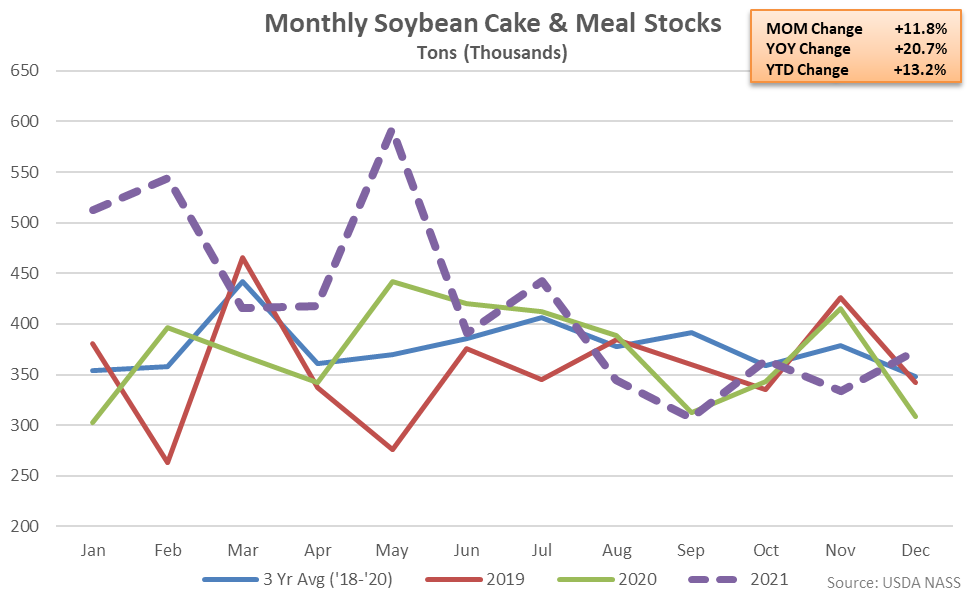
- U.S. soybean cake & meal stocks rebounded to a three year high seasonal level throughout Dec ’21, finishing 20.7% above previous year levels.
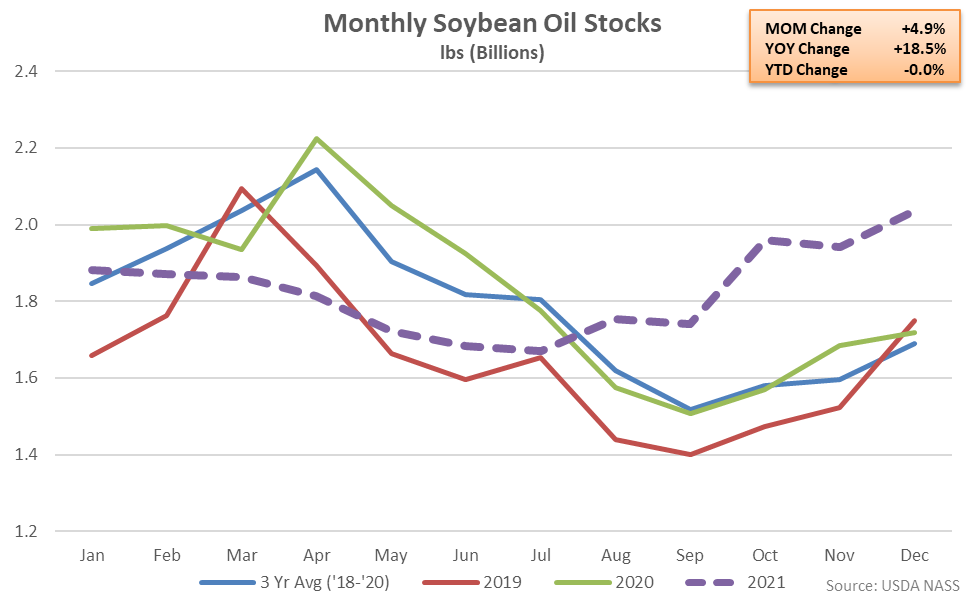
- U.S. soybean oil stocks remained at a record high seasonal level for the fourth consecutive month throughout Dec ’21, finishing 18.5% above previous year levels and reaching a 19 month high level, overall.
Additional Report Details
Soybean Crushing – Crush Reaches a Record High Monthly Level, up 2.6% YOY
According to the USDA, Dec ’21 U.S. soybean crushings reached the highest monthly figure on record, finishing 2.6% above previous year figures. The YOY increase in soybean crushings was just the second experienced throughout the past 11 months. Soybean crushing figures have been compiled since May ’15.
Dec ’21 YOY increases in soybean crushings were largest throughout the North Central states of Michigan, Minnesota, North Dakota and South Dakota. Soybean crushings declined most significantly from the previous year throughout the South, West & Pacific states of Alabama, Arkansas, California, Georgia, Louisiana, Mississippi, North Carolina and South Carolina.
2020 annual soybean crushings finished 5.5% higher on a YOY basis, reaching a record high annual level, however 2021 annual crushings declined by 2.9%.
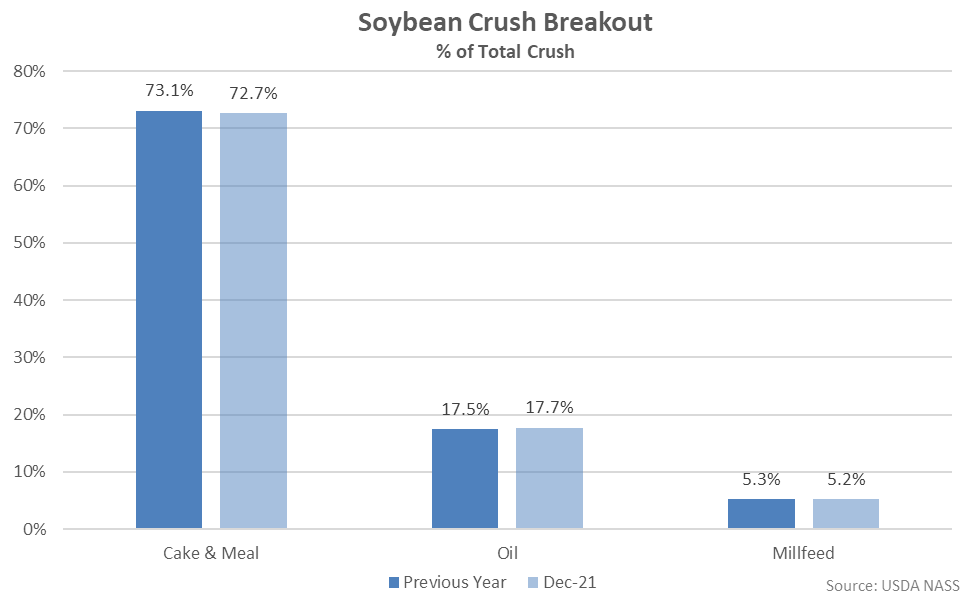
Cake & meal accounted for 72.7% of the total soybean crush throughout Dec ’21, finishing below previous year levels, while oil accounted for 17.7% of the total soybean crush, up from the previous year.
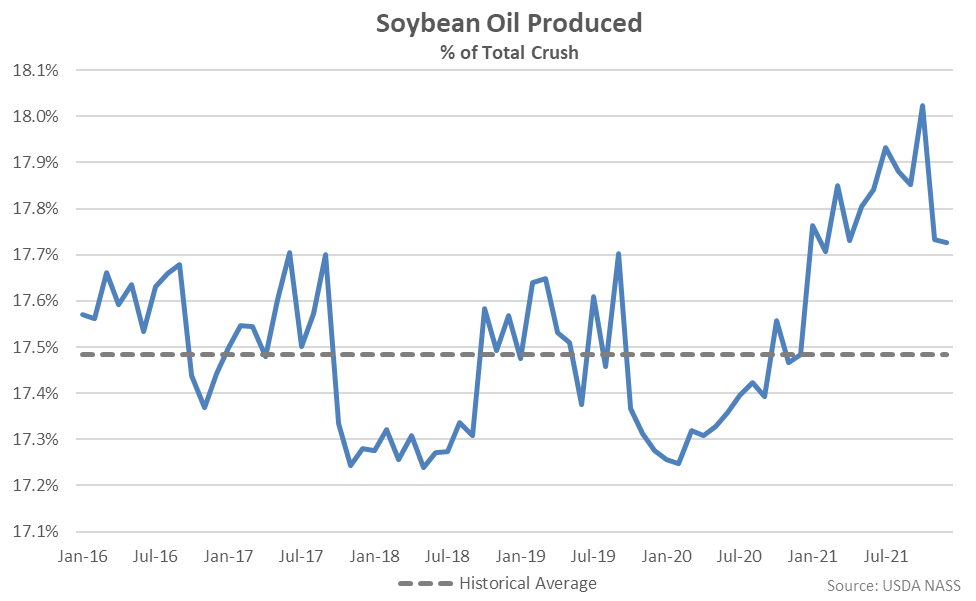
Dec ’21 soybean oil produced as a percentage of total crush declined to an eight month low level but remained historically high, overall. Soybean oil produced as a percentage of total crush has finished above historical average figures over 13 consecutive months through December.
Soybean Cake & Meal Stocks – Stocks Rebound to a Three Year High Seasonal Level, up 20.7% YOY
Dec ’21 U.S. soybean cake & meal stocks rebounded to a five month high level while finishing 20.7% above previous year levels. Soybean cake & meal stocks reached a three year high seasonal level for the month of December. The YOY increase in soybean cake & meal stocks was the second experienced throughout the past three months and the largest experienced throughout the past seven months on a percentage basis. The month-over-month increase in soybean cake & meal stocks of 11.8% was slightly larger than the five year average November – December seasonal build in stocks of 8.5%.
Soybean Oil Stocks – Stocks Remain at a Record High Seasonal Level, up 18.5% YOY
Dec ’21 U.S. soybean oil stocks increased seasonally to a 19 month high level, finishing 18.5% above previous year levels and remaining at a record high seasonal level for the fourth consecutive month. The YOY increase in soybean oil stocks was the fifth experienced in a row. The month-over-month increase in soybean oil stocks of 4.9% was slightly smaller than the five year average November – December seasonal build in stocks of 7.0%.