Soybean Complex Crushing & Stocks Update – Oct ’20
Executive Summary
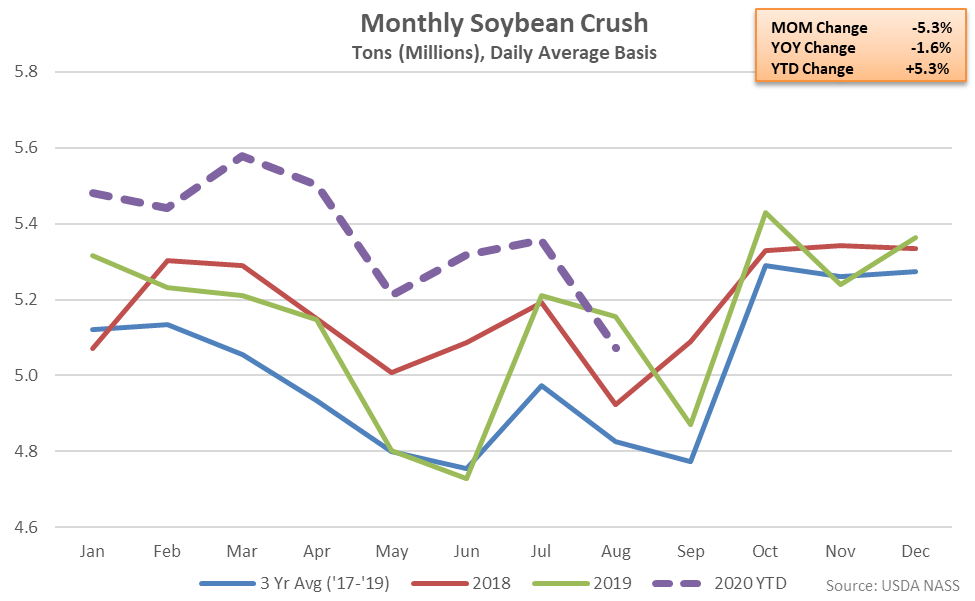
U.S. soybean crush and stocks figures provided by the USDA were recently updated with values spanning through Aug ’20. Highlights from the updated report include:
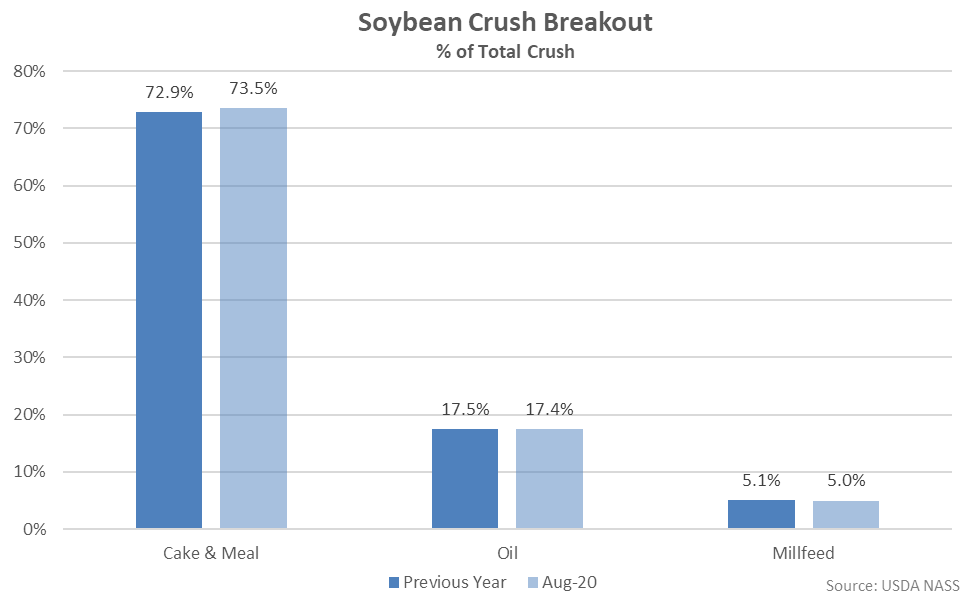
 Cake & meal accounted for 73.5% of the total soybean crush throughout Aug ’20, up slightly from the previous year, while oil accounted for 17.4% of the total soybean crush, down slightly from the previous year.
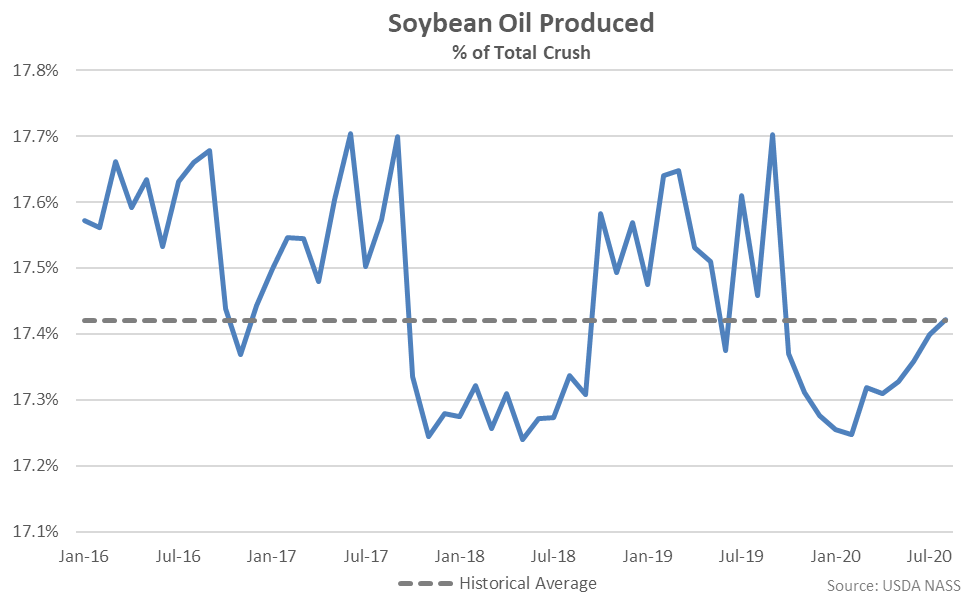
 Aug ’20 soybean oil produced as a percentage of total crush rebounded to an 11 month high level, finishing slightly above historical average figures for the first time in the past 11 months.
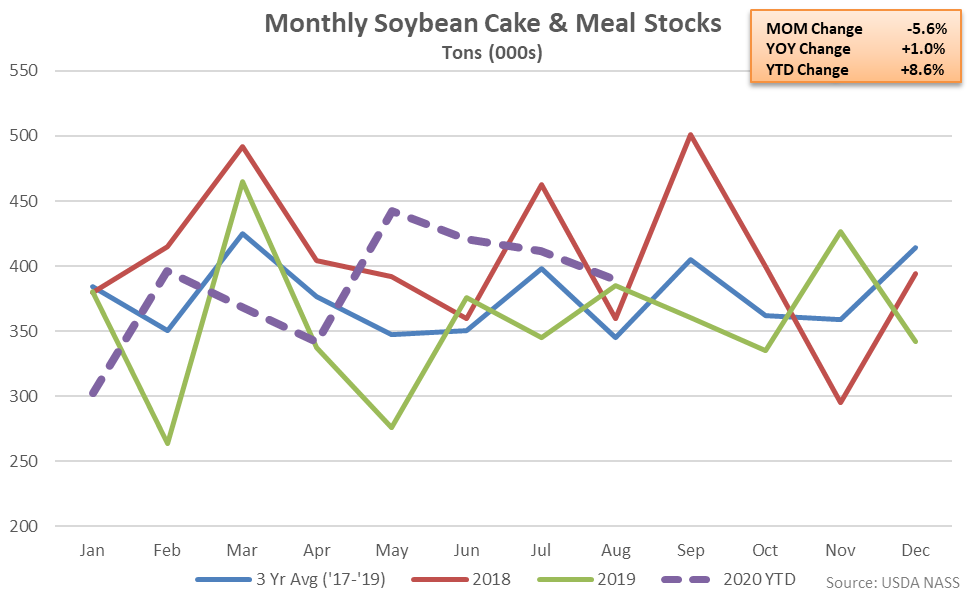
 Soybean Cake & Meal Stocks – Stocks Reach a Record High Seasonal Level, Finish up 1.0% YOY
Aug ’20 U.S. soybean cake & meal stocks declined 5.6% from the previous month but remained 1.0% higher on a YOY basis, reaching a record high seasonal level. The YOY increase in soybean cake & meal stocks was the fifth experienced in a row. The month-over-month decline in soybean cake & meal stocks of 5.6% was smaller than the three year average July – August seasonal decline in stocks of 11.8%. Aug ’20 soybean cake & meal stocks finished 12.6% above three year average seasonal levels, finishing higher for the fourth consecutive month.
Soybean Cake & Meal Stocks – Stocks Reach a Record High Seasonal Level, Finish up 1.0% YOY
Aug ’20 U.S. soybean cake & meal stocks declined 5.6% from the previous month but remained 1.0% higher on a YOY basis, reaching a record high seasonal level. The YOY increase in soybean cake & meal stocks was the fifth experienced in a row. The month-over-month decline in soybean cake & meal stocks of 5.6% was smaller than the three year average July – August seasonal decline in stocks of 11.8%. Aug ’20 soybean cake & meal stocks finished 12.6% above three year average seasonal levels, finishing higher for the fourth consecutive month.
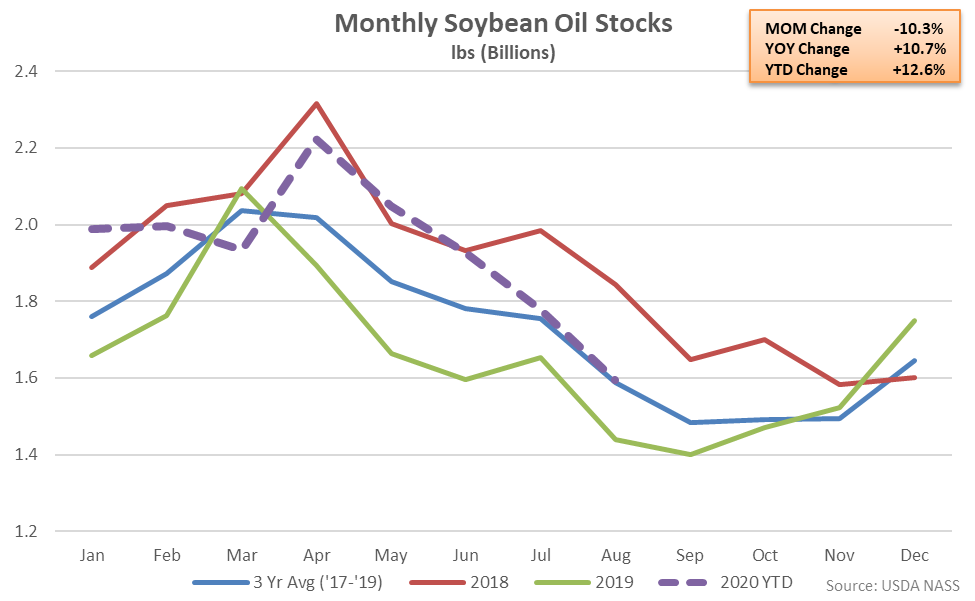
 Soybean Oil Stocks – Stocks Remain Higher YOY for the Eighth Time in Nine Months, up 10.7%
Aug ’20 U.S. soybean oil stocks declined 10.3% from the previous month, reaching a nine month low level but remaining 10.7% higher on a YOY basis. Soybean oil stocks had finished lower on a YOY basis throughout eight consecutive months through Nov ’19 prior to finishing higher throughout eight of the past nine months. The month-over-month decline in soybean oil stocks of 10.3% was largely consistent with the three year average July – August seasonal decline of 9.6%. Aug ’20 soybean oil stocks finished 0.3% above three year average seasonal levels, finishing higher for the eighth time in the past nine months.
Soybean Oil Stocks – Stocks Remain Higher YOY for the Eighth Time in Nine Months, up 10.7%
Aug ’20 U.S. soybean oil stocks declined 10.3% from the previous month, reaching a nine month low level but remaining 10.7% higher on a YOY basis. Soybean oil stocks had finished lower on a YOY basis throughout eight consecutive months through Nov ’19 prior to finishing higher throughout eight of the past nine months. The month-over-month decline in soybean oil stocks of 10.3% was largely consistent with the three year average July – August seasonal decline of 9.6%. Aug ’20 soybean oil stocks finished 0.3% above three year average seasonal levels, finishing higher for the eighth time in the past nine months.
- U.S. soybean crushings declined 1.6% on a YOY basis during Aug ’20, finishing lower for the first time in the past nine months.
- U.S. soybean cake & meal stocks remained higher on a YOY basis for the fifth consecutive month during Aug ’20, finishing up 1.0% and reaching a record high seasonal level.
- U.S. soybean oil stocks remained higher on a YOY basis for the eighth time in the past nine months, finishing up 10.7%.
Cake & meal accounted for 73.5% of the total soybean crush throughout Aug ’20, up slightly from the previous year, while oil accounted for 17.4% of the total soybean crush, down slightly from the previous year.
Aug ’20 soybean oil produced as a percentage of total crush rebounded to an 11 month high level, finishing slightly above historical average figures for the first time in the past 11 months.
Soybean Cake & Meal Stocks – Stocks Reach a Record High Seasonal Level, Finish up 1.0% YOY
Aug ’20 U.S. soybean cake & meal stocks declined 5.6% from the previous month but remained 1.0% higher on a YOY basis, reaching a record high seasonal level. The YOY increase in soybean cake & meal stocks was the fifth experienced in a row. The month-over-month decline in soybean cake & meal stocks of 5.6% was smaller than the three year average July – August seasonal decline in stocks of 11.8%. Aug ’20 soybean cake & meal stocks finished 12.6% above three year average seasonal levels, finishing higher for the fourth consecutive month.
Soybean Oil Stocks – Stocks Remain Higher YOY for the Eighth Time in Nine Months, up 10.7%
Aug ’20 U.S. soybean oil stocks declined 10.3% from the previous month, reaching a nine month low level but remaining 10.7% higher on a YOY basis. Soybean oil stocks had finished lower on a YOY basis throughout eight consecutive months through Nov ’19 prior to finishing higher throughout eight of the past nine months. The month-over-month decline in soybean oil stocks of 10.3% was largely consistent with the three year average July – August seasonal decline of 9.6%. Aug ’20 soybean oil stocks finished 0.3% above three year average seasonal levels, finishing higher for the eighth time in the past nine months.