U.S. Dairy Product Production Update – May ’16
Executive Summary
U.S. dairy product production figures provided by USDA were recently updated with values spanning through Mar ’16. Highlights from the updated report include:
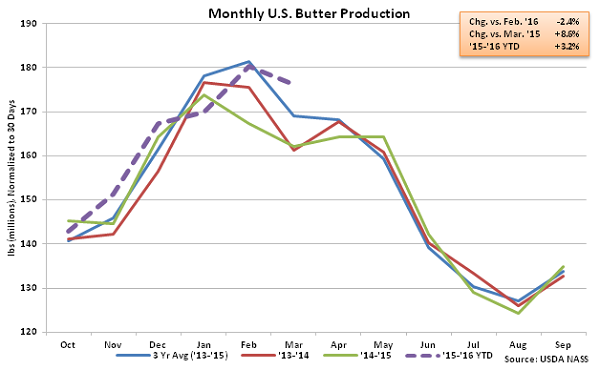
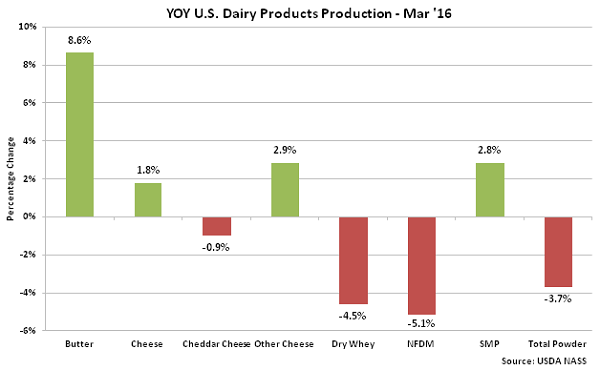
• Mar ’16 U.S. butter production increased to a new record high level for the month of March, finishing up 8.6% YOY.
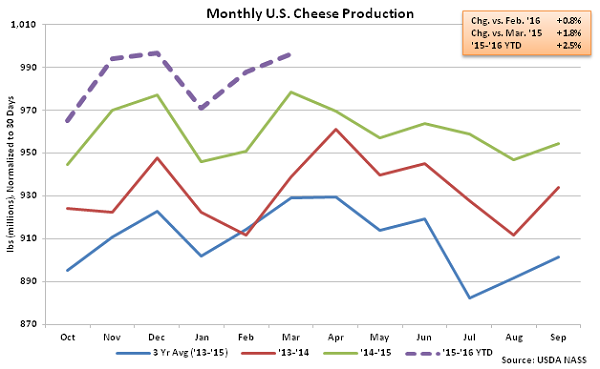
• U.S. cheese production remained strong during Mar ’16, increasing on a YOY basis for the 36th consecutive month and finishing at a record high volume for the month of March.
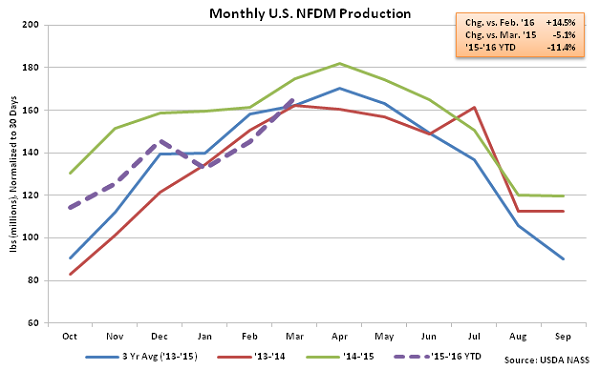
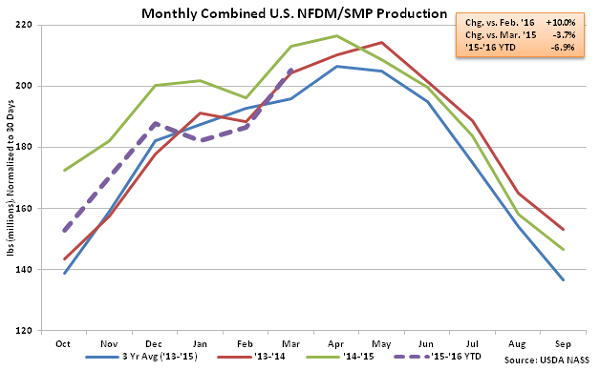
• Combined production of U.S. nonfat dry milk and skim milk powder remained lower on a YOY basis for the 11th consecutive month during Mar ’16, finishing down 3.7%.
Additional Report Details
Butter – Production Reaches New Record High for the Month of March, Finishes up 8.6%
According to USDA, Mar ’16 U.S. butter production of 182.0 million pounds finished 8.6% higher on a YOY basis, reaching a new record high production level for the month of March. The 8.6% YOY growth rate was in addition to a 3.6% upward revision in the previous year output levels. Despite the upward revision, the Mar ’16 YOY growth rate was the largest experienced throughout the past four years. YOY increases in butter production were widespread across the U.S. and led by the Western region, which increased production by 8.6% YOY. Butter production within the Atlantic U.S. and Central U.S. increased by 1.0% and 0.5%, respectively, during Mar ’16. ’14-’15 annual butter production finished down 0.7% YOY to a four year low however ’15-’16 YTD butter production is up 3.2% YOY throughout the first half of the production season.
 Cheese – Production Reaches New Record High for the Month of March, Finishes up 1.8%
Mar ’16 total U.S. cheese production of 1.03 billion pounds increased YOY for the 36th consecutive month, finishing 1.8% higher than the previous year and reaching a new record high production level for the month of March. The 1.8% YOY growth rate was in addition to a 1.5% upward revision in the previous year output levels. Cheddar cheese production of 284.5 million pounds declined 0.9% YOY however the YOY decline in cheddar production was more than offset by a 2.9% YOY increase in other-than-Cheddar cheese production. ’14-’15 annual total cheese production finished up 3.0% YOY while cheddar cheese production finished up 3.1%.’15-’16 YTD cheese production is up an additional 2.5% YOY throughout the first half of the production season.
Cheese – Production Reaches New Record High for the Month of March, Finishes up 1.8%
Mar ’16 total U.S. cheese production of 1.03 billion pounds increased YOY for the 36th consecutive month, finishing 1.8% higher than the previous year and reaching a new record high production level for the month of March. The 1.8% YOY growth rate was in addition to a 1.5% upward revision in the previous year output levels. Cheddar cheese production of 284.5 million pounds declined 0.9% YOY however the YOY decline in cheddar production was more than offset by a 2.9% YOY increase in other-than-Cheddar cheese production. ’14-’15 annual total cheese production finished up 3.0% YOY while cheddar cheese production finished up 3.1%.’15-’16 YTD cheese production is up an additional 2.5% YOY throughout the first half of the production season.
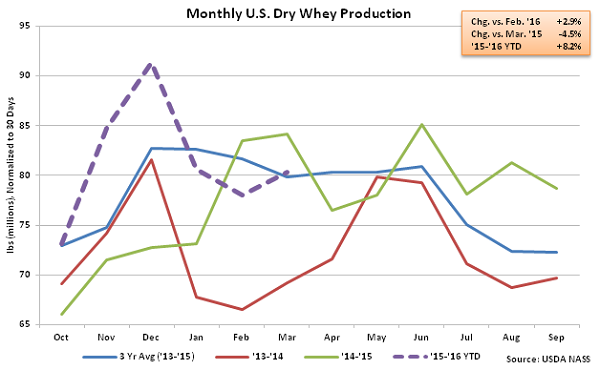
 Dry Whey – Production Declines on a YOY Basis for the Second Consecutive Month
Mar ’16 U.S. dry whey production of 72.9 million pounds declined YOY for the second consecutive month, finishing 4.5% below the previous year. Combined whey protein concentrate (WPC) and whey protein isolate (WPI) production remained lower on a YOY basis, declining by 8.1%, while Mar ’16 combined dry whey, WPC and WPI production finished 5.9% below than the previous year. Despite the YOY declines experienced during Mar ’16, ’15-’16 YTD dry whey production remains up 8.2% YOY throughout the first half of the production season, with combined production of dry whey, WPC and WPI up 1.9% over the same period.
Dry Whey – Production Declines on a YOY Basis for the Second Consecutive Month
Mar ’16 U.S. dry whey production of 72.9 million pounds declined YOY for the second consecutive month, finishing 4.5% below the previous year. Combined whey protein concentrate (WPC) and whey protein isolate (WPI) production remained lower on a YOY basis, declining by 8.1%, while Mar ’16 combined dry whey, WPC and WPI production finished 5.9% below than the previous year. Despite the YOY declines experienced during Mar ’16, ’15-’16 YTD dry whey production remains up 8.2% YOY throughout the first half of the production season, with combined production of dry whey, WPC and WPI up 1.9% over the same period.
 NFDM/SMP – Combined Production Declines YOY for the 11th Consecutive Month
Mar ’16 U.S. nonfat dry milk (NFDM) production of 171.6 million pounds declined YOY for the sixth consecutive month, finishing 5.1% below the previous year. Skim milk powder (SMP), which is more suited to the requirements of most global markets, increased YOY for the fifth consecutive month, as production of 40.6 million pounds finished 2.8% above the previous year. Overall, Mar ’16 combined production of NFDM and SMP declined YOY for the 11th consecutive month, falling 3.7% YOY. Combined production of NFDM and SMP is down 6.9% YOY throughout the first half of the ’15-’16 production season.
NFDM/SMP – Combined Production Declines YOY for the 11th Consecutive Month
Mar ’16 U.S. nonfat dry milk (NFDM) production of 171.6 million pounds declined YOY for the sixth consecutive month, finishing 5.1% below the previous year. Skim milk powder (SMP), which is more suited to the requirements of most global markets, increased YOY for the fifth consecutive month, as production of 40.6 million pounds finished 2.8% above the previous year. Overall, Mar ’16 combined production of NFDM and SMP declined YOY for the 11th consecutive month, falling 3.7% YOY. Combined production of NFDM and SMP is down 6.9% YOY throughout the first half of the ’15-’16 production season.
 Overall, butter production increased most significantly YOY during Mar ’16 on a percentage basis, followed by SMP and cheese. NFDM production declined the most on a percentage basis throughout the month, followed by dry whey.
Cheese – Production Reaches New Record High for the Month of March, Finishes up 1.8%
Mar ’16 total U.S. cheese production of 1.03 billion pounds increased YOY for the 36th consecutive month, finishing 1.8% higher than the previous year and reaching a new record high production level for the month of March. The 1.8% YOY growth rate was in addition to a 1.5% upward revision in the previous year output levels. Cheddar cheese production of 284.5 million pounds declined 0.9% YOY however the YOY decline in cheddar production was more than offset by a 2.9% YOY increase in other-than-Cheddar cheese production. ’14-’15 annual total cheese production finished up 3.0% YOY while cheddar cheese production finished up 3.1%.’15-’16 YTD cheese production is up an additional 2.5% YOY throughout the first half of the production season.
Dry Whey – Production Declines on a YOY Basis for the Second Consecutive Month
Mar ’16 U.S. dry whey production of 72.9 million pounds declined YOY for the second consecutive month, finishing 4.5% below the previous year. Combined whey protein concentrate (WPC) and whey protein isolate (WPI) production remained lower on a YOY basis, declining by 8.1%, while Mar ’16 combined dry whey, WPC and WPI production finished 5.9% below than the previous year. Despite the YOY declines experienced during Mar ’16, ’15-’16 YTD dry whey production remains up 8.2% YOY throughout the first half of the production season, with combined production of dry whey, WPC and WPI up 1.9% over the same period.
NFDM/SMP – Combined Production Declines YOY for the 11th Consecutive Month
Mar ’16 U.S. nonfat dry milk (NFDM) production of 171.6 million pounds declined YOY for the sixth consecutive month, finishing 5.1% below the previous year. Skim milk powder (SMP), which is more suited to the requirements of most global markets, increased YOY for the fifth consecutive month, as production of 40.6 million pounds finished 2.8% above the previous year. Overall, Mar ’16 combined production of NFDM and SMP declined YOY for the 11th consecutive month, falling 3.7% YOY. Combined production of NFDM and SMP is down 6.9% YOY throughout the first half of the ’15-’16 production season.
Overall, butter production increased most significantly YOY during Mar ’16 on a percentage basis, followed by SMP and cheese. NFDM production declined the most on a percentage basis throughout the month, followed by dry whey.