U.S. Commercial Disappearance Update – Nov ’15
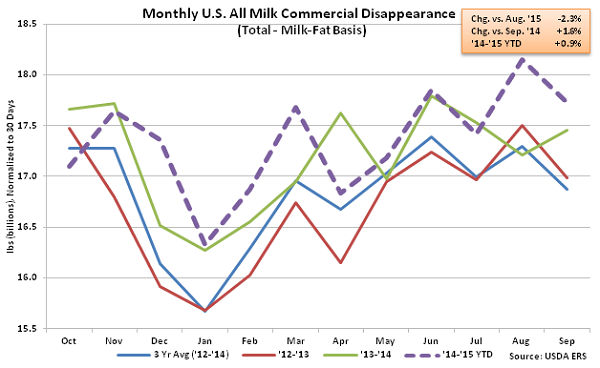
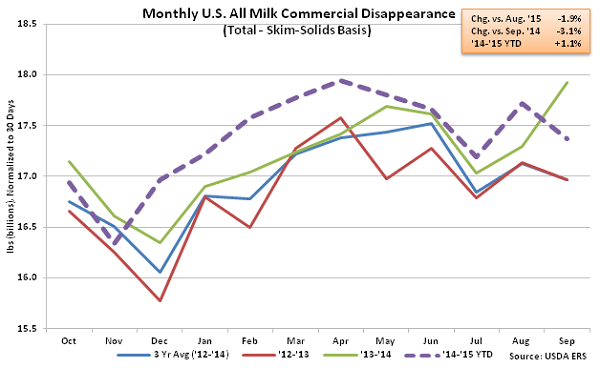
All Milk – Disappearance Remains Higher YOY on Milk-Fat Basis, Declines YOY on Skim-Solids Basis
According to USDA, Sep ’15 U.S. commercial disappearance for milk used in all products on a milk-fat basis declined 2.3% MOM from the all-time record high experienced in Aug ’15 but remained higher on a YOY basis, increasing 1.6% to a record high for the month of September. Commercial disappearance for milk used in all products on a skim-solids basis declined YOY for the first time in ten months, however, finishing 3.1% below the previous year. Domestic demand remained strong on a milk-fat basis, finishing up 2.4% YOY but finished 6.5% lower than the previous year on a skim-solids basis. ’14-’15 annual commercial disappearance for milk used in all products finished up 0.9% YOY on a milk-fat basis and 1.1% YOY on a skim-solids basis, with domestic demand finishing up 3.2% on a milk-fat basis and 2.3% on a skim-solids basis.
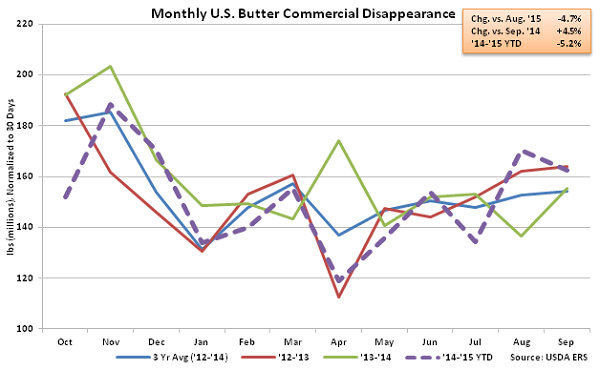
 Butter – Disappearance Increases YOY for Second Consecutive Month Despite Weak Export Demand
Sep ’15 U.S. butter commercial disappearance declined 4.7% MOM on a daily average basis but remained higher YOY, finishing 4.5% above the previous year. Butter disappearance remained higher on a YOY basis despite international demand continuing to remain weak. Sep ’15 domestic butter demand finished up 7.4% YOY while international demand declined 82.7% YOY. U.S. butterfat exports have declined YOY for 17 consecutive months as U.S. butter prices have traded at a premium to international prices and the U.S. Dollar has appreciated vs. rival currencies. Despite the recent increases in butter disappearance, ’14-’15 annual U.S. butter commercial disappearance declined 5.2% YOY to a three year low as a 74.8% decline in exports more than offset a 1.6% increase in domestic demand.
Butter – Disappearance Increases YOY for Second Consecutive Month Despite Weak Export Demand
Sep ’15 U.S. butter commercial disappearance declined 4.7% MOM on a daily average basis but remained higher YOY, finishing 4.5% above the previous year. Butter disappearance remained higher on a YOY basis despite international demand continuing to remain weak. Sep ’15 domestic butter demand finished up 7.4% YOY while international demand declined 82.7% YOY. U.S. butterfat exports have declined YOY for 17 consecutive months as U.S. butter prices have traded at a premium to international prices and the U.S. Dollar has appreciated vs. rival currencies. Despite the recent increases in butter disappearance, ’14-’15 annual U.S. butter commercial disappearance declined 5.2% YOY to a three year low as a 74.8% decline in exports more than offset a 1.6% increase in domestic demand.
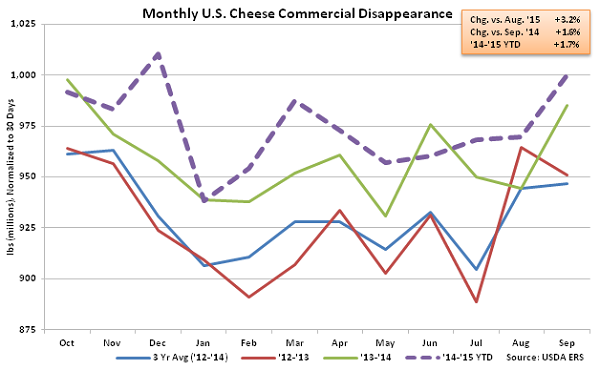
 Cheese – Disappearance Reaches Record High for the Month of September, Finishes up 1.6% YOY
Sep ’15 U.S. cheese commercial disappearance remained strong, increasing 3.2% MOM on a daily average basis and 1.6% YOY to a new record high for the month of September. The YOY increase in cheese disappearance was the seventh experienced in the past eight months. Other-than-American cheese disappearance was particularly strong, increasing by 1.9% YOY while American cheese disappearance finished up 1.0% YOY. Domestic cheese demand increased 3.0% YOY however export demand remained weak, declining 20.3% YOY. Cheese export volumes have declined YOY for 12 consecutive months while domestic demand has increased YOY for 11 consecutive months through September. ’14-’15 annual U.S. cheese commercial disappearance finished up 1.7% YOY to a new record annual high as a 2.9% increase in domestic demand more than offset a 14.1% decline in export demand.
Cheese – Disappearance Reaches Record High for the Month of September, Finishes up 1.6% YOY
Sep ’15 U.S. cheese commercial disappearance remained strong, increasing 3.2% MOM on a daily average basis and 1.6% YOY to a new record high for the month of September. The YOY increase in cheese disappearance was the seventh experienced in the past eight months. Other-than-American cheese disappearance was particularly strong, increasing by 1.9% YOY while American cheese disappearance finished up 1.0% YOY. Domestic cheese demand increased 3.0% YOY however export demand remained weak, declining 20.3% YOY. Cheese export volumes have declined YOY for 12 consecutive months while domestic demand has increased YOY for 11 consecutive months through September. ’14-’15 annual U.S. cheese commercial disappearance finished up 1.7% YOY to a new record annual high as a 2.9% increase in domestic demand more than offset a 14.1% decline in export demand.
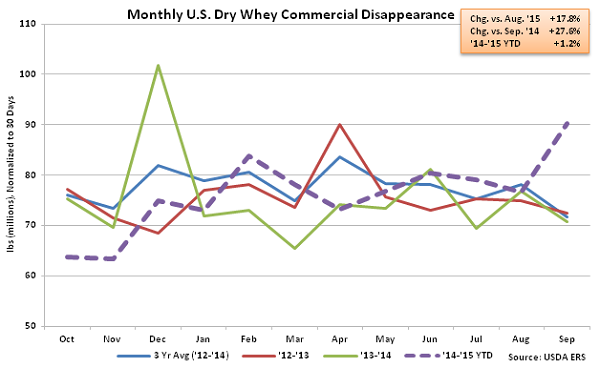
 Dry Whey – Disappearance Increases Sharply to a 15 Year High for the Month of September
Sep ’15 U.S. dry whey commercial disappearance increased sharply, finishing up 27.6% YOY and 17.8% MOM on a daily average basis to a 15 year high for the month of September. Domestic dry whey commercial disappearance remained strong, increasing YOY for the ninth consecutive month and finishing 91.6% above the previous year, however U.S. dry whey export demand remained weak, finishing down 32.2% YOY. ’14-’15 annual U.S. dry whey commercial disappearance increased 1.2% YOY as a 26.1% increase in domestic demand more than offset a 17.9% decline in export demand.
Dry Whey – Disappearance Increases Sharply to a 15 Year High for the Month of September
Sep ’15 U.S. dry whey commercial disappearance increased sharply, finishing up 27.6% YOY and 17.8% MOM on a daily average basis to a 15 year high for the month of September. Domestic dry whey commercial disappearance remained strong, increasing YOY for the ninth consecutive month and finishing 91.6% above the previous year, however U.S. dry whey export demand remained weak, finishing down 32.2% YOY. ’14-’15 annual U.S. dry whey commercial disappearance increased 1.2% YOY as a 26.1% increase in domestic demand more than offset a 17.9% decline in export demand.
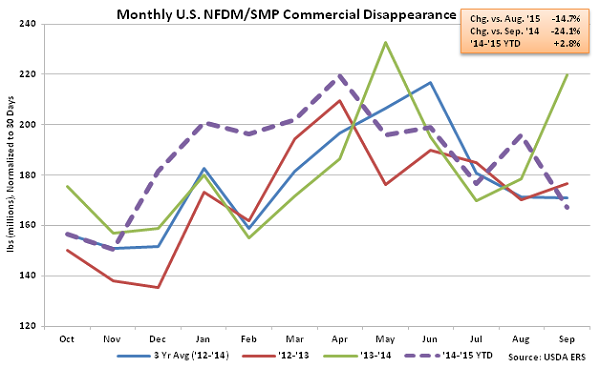
 NFDM/SMP – Disappearance Declines Sharply, Finishes Down 24.1% YOY
Sep ’15 U.S. NFDM/SMP commercial disappearance declined 14.7% MOM on a daily average basis and 24.1% YOY to a three year low for the month of September. Declines in commercial disappearance were exhibited despite NFDM/SMP exports increasing on a YOY basis for the first time in four months during Sep ’15. Domestic NFDM/SMP commercial disappearance declined sharply on a YOY basis, finishing 58.2% below the three year high experienced in September of 2014. Despite the decline, ’14-’15 annual U.S. NFDM/SMP commercial disappearance finished up 2.8% YOY as a 12.1% increase in domestic demand more than offset a 4.7% decline in export demand.
NFDM/SMP – Disappearance Declines Sharply, Finishes Down 24.1% YOY
Sep ’15 U.S. NFDM/SMP commercial disappearance declined 14.7% MOM on a daily average basis and 24.1% YOY to a three year low for the month of September. Declines in commercial disappearance were exhibited despite NFDM/SMP exports increasing on a YOY basis for the first time in four months during Sep ’15. Domestic NFDM/SMP commercial disappearance declined sharply on a YOY basis, finishing 58.2% below the three year high experienced in September of 2014. Despite the decline, ’14-’15 annual U.S. NFDM/SMP commercial disappearance finished up 2.8% YOY as a 12.1% increase in domestic demand more than offset a 4.7% decline in export demand.
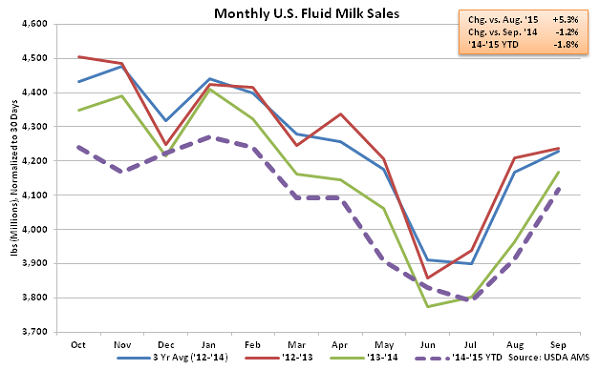
 Fluid Milk Sales – Fat-Free Sales Continue to Weigh Down Overall Figures
Sep ’15 U.S. fluid milk sales of 4.12 billion pounds declined YOY for the 20th time in the past 21 months, finishing 1.2% below the previous year. Total fluid milk sales continued to increase seasonally from the record low reached in Jul ’15 but remained at the lowest figure on record for the month of September. Sales of whole milk remained strong, finishing up 4.7% YOY, while fat-free milk sales declined 9.7% YOY. ’14-’15 annual total fluid milk sales finished down 1.8% YOY to the lowest annual figure on record. Annual whole milk sales finished up 2.2% however annual fat-free milk sales declined 10.8%.
Fluid Milk Sales – Fat-Free Sales Continue to Weigh Down Overall Figures
Sep ’15 U.S. fluid milk sales of 4.12 billion pounds declined YOY for the 20th time in the past 21 months, finishing 1.2% below the previous year. Total fluid milk sales continued to increase seasonally from the record low reached in Jul ’15 but remained at the lowest figure on record for the month of September. Sales of whole milk remained strong, finishing up 4.7% YOY, while fat-free milk sales declined 9.7% YOY. ’14-’15 annual total fluid milk sales finished down 1.8% YOY to the lowest annual figure on record. Annual whole milk sales finished up 2.2% however annual fat-free milk sales declined 10.8%.
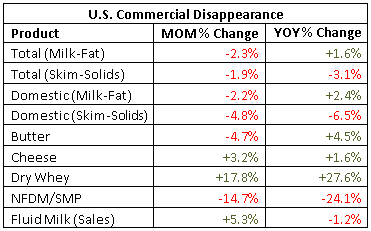
 See the table below for a summary of key Sep ’15 U.S. dairy commercial disappearance figures in addition to the Sep ’15 U.S. fluid milk sales figure.
Butter – Disappearance Increases YOY for Second Consecutive Month Despite Weak Export Demand
Sep ’15 U.S. butter commercial disappearance declined 4.7% MOM on a daily average basis but remained higher YOY, finishing 4.5% above the previous year. Butter disappearance remained higher on a YOY basis despite international demand continuing to remain weak. Sep ’15 domestic butter demand finished up 7.4% YOY while international demand declined 82.7% YOY. U.S. butterfat exports have declined YOY for 17 consecutive months as U.S. butter prices have traded at a premium to international prices and the U.S. Dollar has appreciated vs. rival currencies. Despite the recent increases in butter disappearance, ’14-’15 annual U.S. butter commercial disappearance declined 5.2% YOY to a three year low as a 74.8% decline in exports more than offset a 1.6% increase in domestic demand.
Cheese – Disappearance Reaches Record High for the Month of September, Finishes up 1.6% YOY
Sep ’15 U.S. cheese commercial disappearance remained strong, increasing 3.2% MOM on a daily average basis and 1.6% YOY to a new record high for the month of September. The YOY increase in cheese disappearance was the seventh experienced in the past eight months. Other-than-American cheese disappearance was particularly strong, increasing by 1.9% YOY while American cheese disappearance finished up 1.0% YOY. Domestic cheese demand increased 3.0% YOY however export demand remained weak, declining 20.3% YOY. Cheese export volumes have declined YOY for 12 consecutive months while domestic demand has increased YOY for 11 consecutive months through September. ’14-’15 annual U.S. cheese commercial disappearance finished up 1.7% YOY to a new record annual high as a 2.9% increase in domestic demand more than offset a 14.1% decline in export demand.
Dry Whey – Disappearance Increases Sharply to a 15 Year High for the Month of September
Sep ’15 U.S. dry whey commercial disappearance increased sharply, finishing up 27.6% YOY and 17.8% MOM on a daily average basis to a 15 year high for the month of September. Domestic dry whey commercial disappearance remained strong, increasing YOY for the ninth consecutive month and finishing 91.6% above the previous year, however U.S. dry whey export demand remained weak, finishing down 32.2% YOY. ’14-’15 annual U.S. dry whey commercial disappearance increased 1.2% YOY as a 26.1% increase in domestic demand more than offset a 17.9% decline in export demand.
NFDM/SMP – Disappearance Declines Sharply, Finishes Down 24.1% YOY
Sep ’15 U.S. NFDM/SMP commercial disappearance declined 14.7% MOM on a daily average basis and 24.1% YOY to a three year low for the month of September. Declines in commercial disappearance were exhibited despite NFDM/SMP exports increasing on a YOY basis for the first time in four months during Sep ’15. Domestic NFDM/SMP commercial disappearance declined sharply on a YOY basis, finishing 58.2% below the three year high experienced in September of 2014. Despite the decline, ’14-’15 annual U.S. NFDM/SMP commercial disappearance finished up 2.8% YOY as a 12.1% increase in domestic demand more than offset a 4.7% decline in export demand.
Fluid Milk Sales – Fat-Free Sales Continue to Weigh Down Overall Figures
Sep ’15 U.S. fluid milk sales of 4.12 billion pounds declined YOY for the 20th time in the past 21 months, finishing 1.2% below the previous year. Total fluid milk sales continued to increase seasonally from the record low reached in Jul ’15 but remained at the lowest figure on record for the month of September. Sales of whole milk remained strong, finishing up 4.7% YOY, while fat-free milk sales declined 9.7% YOY. ’14-’15 annual total fluid milk sales finished down 1.8% YOY to the lowest annual figure on record. Annual whole milk sales finished up 2.2% however annual fat-free milk sales declined 10.8%.
See the table below for a summary of key Sep ’15 U.S. dairy commercial disappearance figures in addition to the Sep ’15 U.S. fluid milk sales figure.