U.S. Milk Production Update – Nov ’15
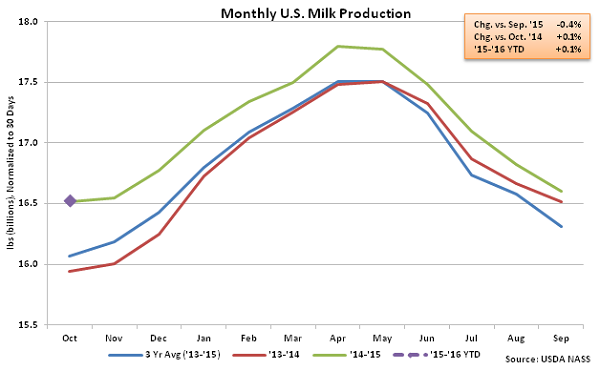
According to USDA, Oct ’15 U.S. milk production was up 0.1% YOY, at 17,080 million pounds, setting a new October production record. Production continued to decline MOM, however, contracting 0.4% on a daily average basis. U.S. milk production has reached seasonal lows in October during eight of the past ten years and has declined by an average of 0.2% from September – October over the period.
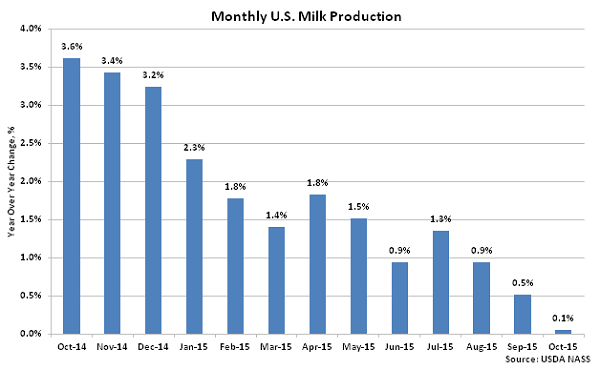
 U.S. milk production remained significantly higher on a YOY basis throughout the final quarter of 2014, as shown below, however production growth has decelerated over the past 12 months. The Oct ’15 YOY growth rate of 0.1% was a 23 month low and significantly below the ’14-’15 annual growth rate of 1.9%.
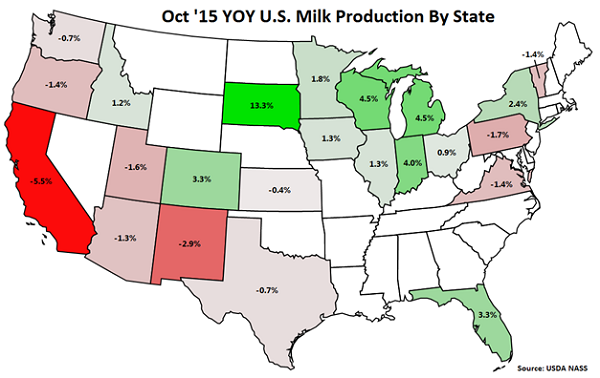
 YOY production gains on a percentage basis continue to be led by South Dakota (+13.3%), followed by Wisconsin (+4.5%) and Michigan (+4.5%). California milk production declined YOY for the 11th consecutive month, finishing 5.5% lower, while production in New Mexico, Pennsylvania, Utah, Vermont, Oregon, Virginia, Arizona, Texas, Washington and Kansas also finished lower than the previous year. California, New Mexico, Pennsylvania, Vermont, Oregon and Washington experienced lower YOY milk per cow yields while California, Vermont, Oregon, Virginia and Texas experienced reductions in their milk cow herds.
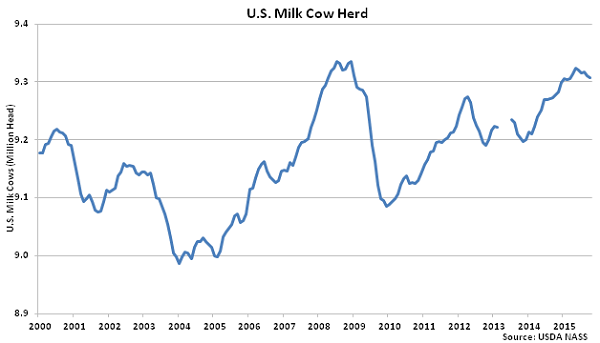
 Overall, the U.S. milk cow herd declined MOM for the fourth time in five months during Oct ’15, finishing 1,000 head below the previous month and reaching a new seven month low. The total U.S. milk cow herd currently stands at 9,309,000 head, which remains 32,000 head more than October of last year.
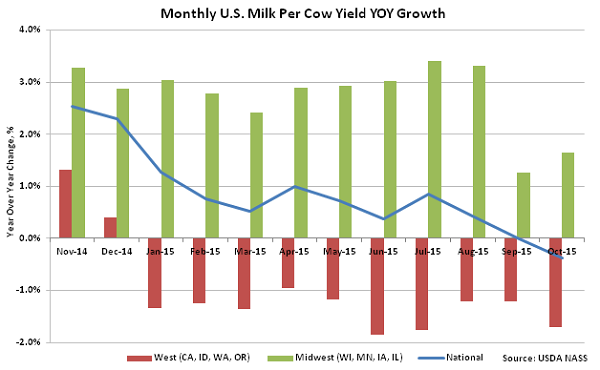
 The U.S. milk per cow yield declined YOY for the first time in nearly two years, finishing down 0.3%. Milk per cow yields continue to trend higher YOY in the Midwest but increases within the Midwest were more than offset by declining milk per cow yields in the Western United States. Milk per cow yields increased by an average of 1.6% YOY within Wisconsin, Minnesota, Iowa and Illinois while yields declined 1.7% YOY on average within California, Idaho, Washington and Oregon.
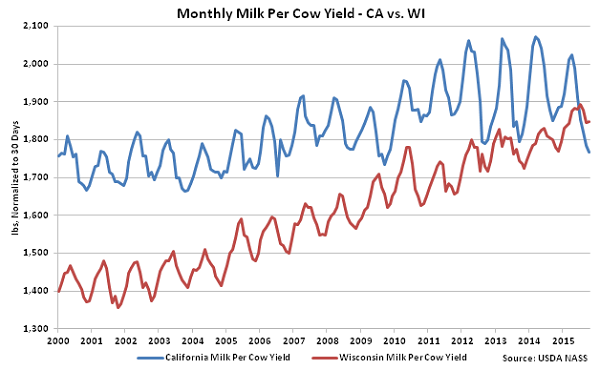
 Wisconsin milk per cow yields increased to a new 79 year high relative to California milk per cow yields during Oct ’15 while finishing higher than California yields on an absolute basis for the fourth consecutive month.
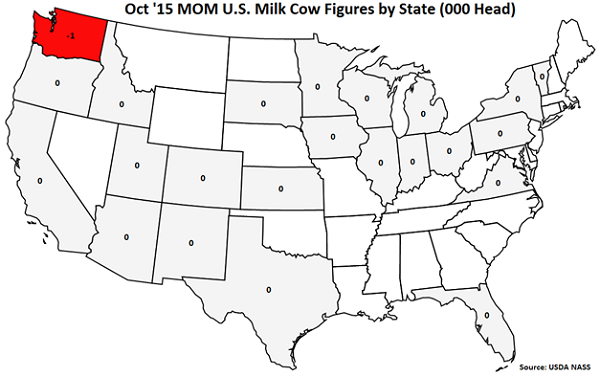
 The only MOM decline in the milk cow herd was exhibited in Washington (-1,000 head) while no MOM increases in the milk per herd were experienced.
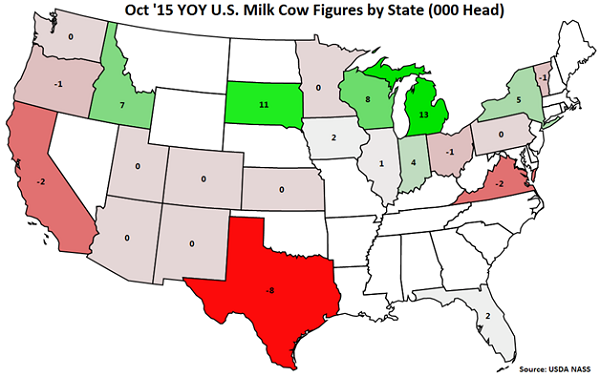
 YOY increases in milk cow herds continue to be led by Michigan (+13,000 head), followed by South Dakota (+11,000 head), Wisconsin (+8,000 head) and Idaho (+7,000 head). Texas (-8,000 head), California (-2,000 head), Virginia, (-2,000 head), Oregon (-1,000 head), Ohio (-1,000 head) and Vermont (-1,000 head) experienced YOY reductions in their milk cow herds.
U.S. milk production remained significantly higher on a YOY basis throughout the final quarter of 2014, as shown below, however production growth has decelerated over the past 12 months. The Oct ’15 YOY growth rate of 0.1% was a 23 month low and significantly below the ’14-’15 annual growth rate of 1.9%.
YOY production gains on a percentage basis continue to be led by South Dakota (+13.3%), followed by Wisconsin (+4.5%) and Michigan (+4.5%). California milk production declined YOY for the 11th consecutive month, finishing 5.5% lower, while production in New Mexico, Pennsylvania, Utah, Vermont, Oregon, Virginia, Arizona, Texas, Washington and Kansas also finished lower than the previous year. California, New Mexico, Pennsylvania, Vermont, Oregon and Washington experienced lower YOY milk per cow yields while California, Vermont, Oregon, Virginia and Texas experienced reductions in their milk cow herds.
Overall, the U.S. milk cow herd declined MOM for the fourth time in five months during Oct ’15, finishing 1,000 head below the previous month and reaching a new seven month low. The total U.S. milk cow herd currently stands at 9,309,000 head, which remains 32,000 head more than October of last year.
The U.S. milk per cow yield declined YOY for the first time in nearly two years, finishing down 0.3%. Milk per cow yields continue to trend higher YOY in the Midwest but increases within the Midwest were more than offset by declining milk per cow yields in the Western United States. Milk per cow yields increased by an average of 1.6% YOY within Wisconsin, Minnesota, Iowa and Illinois while yields declined 1.7% YOY on average within California, Idaho, Washington and Oregon.
Wisconsin milk per cow yields increased to a new 79 year high relative to California milk per cow yields during Oct ’15 while finishing higher than California yields on an absolute basis for the fourth consecutive month.
The only MOM decline in the milk cow herd was exhibited in Washington (-1,000 head) while no MOM increases in the milk per herd were experienced.
YOY increases in milk cow herds continue to be led by Michigan (+13,000 head), followed by South Dakota (+11,000 head), Wisconsin (+8,000 head) and Idaho (+7,000 head). Texas (-8,000 head), California (-2,000 head), Virginia, (-2,000 head), Oregon (-1,000 head), Ohio (-1,000 head) and Vermont (-1,000 head) experienced YOY reductions in their milk cow herds.