U.S. Dairy Exports Update – Mar ’16
Executive Summary
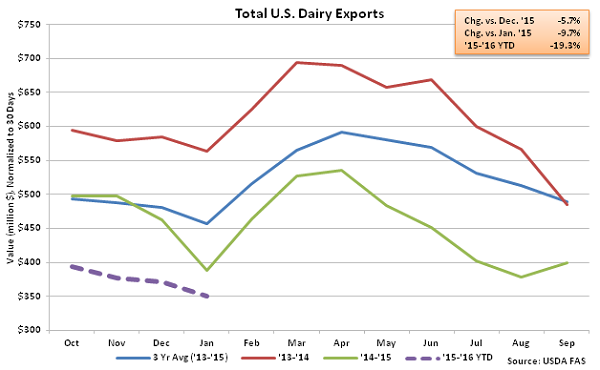
U.S. dairy export figures provided by USDA were recently updated with values spanning through Jan ’16. Highlights from the updated report include:
• The total value of U.S. dairy exports reached a five year low during Jan ’16 while U.S. dairy imports as a percentage of production were the largest experienced since Feb ’09.
• The U.S. was a net importer of butter for the 12th consecutive month in Jan ’16 as domestic prices remain at a significant premium to international prices.
• NFDM/SMP export volumes remained higher on a YOY basis for the fifth consecutive month, finishing up 22.7%, as demand strengthened throughout Southeast Asia.
Additional Report Details
According to USDA, the total value of all U.S. dairy exports remained lower on a YOY basis for the 18th consecutive month in Jan ’16, finishing down 9.7% to a new five year low. U.S. high milkfat dairy product prices continued to remain significantly above international prices throughout Jan ’16 while export volumes also continued to be negatively affected by a strengthening dollar relative to the currencies of traditional buyers of U.S. dairy products. A strengthening dollar results in less purchasing power for importing countries, and ultimately less foreign demand for U.S. products, all other factors being equal.
 Butter – U.S. Remains a Net Importer of Butter for 12th Consecutive Month
Jan ’16 export volumes of butterfat continued to increase off of the eight and a half year low experienced in Sep ’15, finishing higher on a YOY basis for the first time in 21 months. Jan ’16 butterfat export volumes increased 1.4% YOY and 35.3% MOM on a daily average basis, however butterfat imports continued to exceed export volumes throughout the month. The U.S. was a net importer of butter for the 12th consecutive month during Jan ’16, as total butterfat import volumes exceeded butterfat export volumes by nearly 60% throughout the month.
Butter – U.S. Remains a Net Importer of Butter for 12th Consecutive Month
Jan ’16 export volumes of butterfat continued to increase off of the eight and a half year low experienced in Sep ’15, finishing higher on a YOY basis for the first time in 21 months. Jan ’16 butterfat export volumes increased 1.4% YOY and 35.3% MOM on a daily average basis, however butterfat imports continued to exceed export volumes throughout the month. The U.S. was a net importer of butter for the 12th consecutive month during Jan ’16, as total butterfat import volumes exceeded butterfat export volumes by nearly 60% throughout the month.
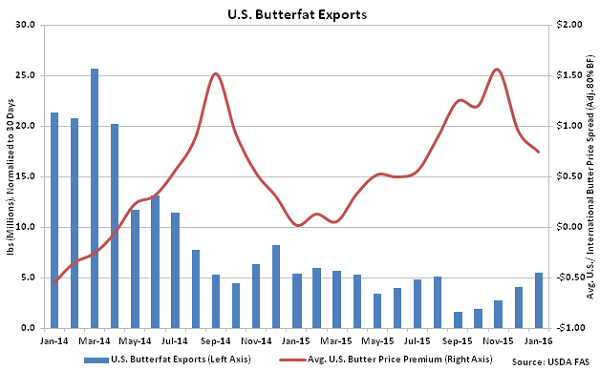
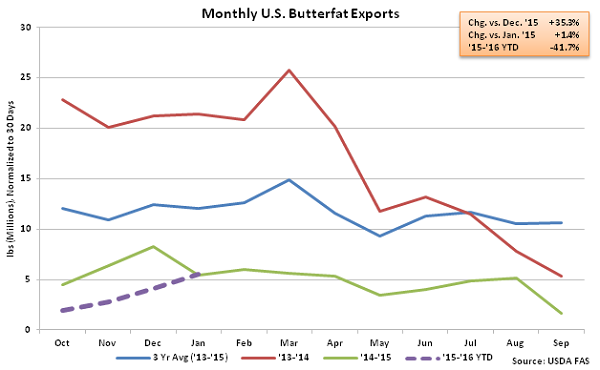 U.S. butter prices have traded at a premium to Europe and New Zealand butter prices when adjusted to 80% butterfat since May ’14, reducing export demand. The U.S. / international butter price spread reached an 11 year high during Nov ’15 prior to declining but remained at a significant premium throughout more recent months. ’14-’15 annual butterfat exports finished down 69.9% YOY while annual butterfat imports finished up 172.5% YOY.
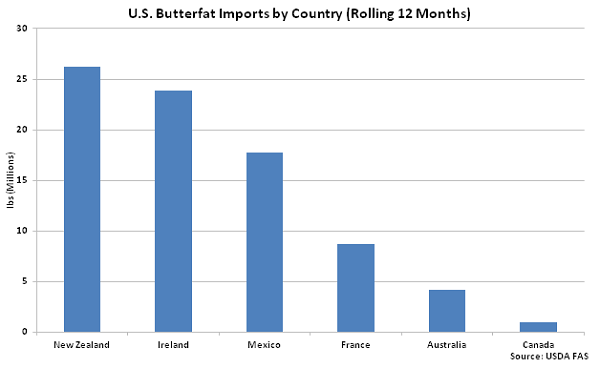
 Overall, ’14-’15 annual U.S. butterfat imports reached a new nine year high. ’15-’16 YTD butterfat imports have increased an additional 29.9% throughout the first third of the production season, while butter exports have declined 41.7% YOY over the same period. Growth in butterfat imports over the past 12 months has been led by product shipped from New Zealand, followed by imports of butterfat from Ireland, Mexico and France.
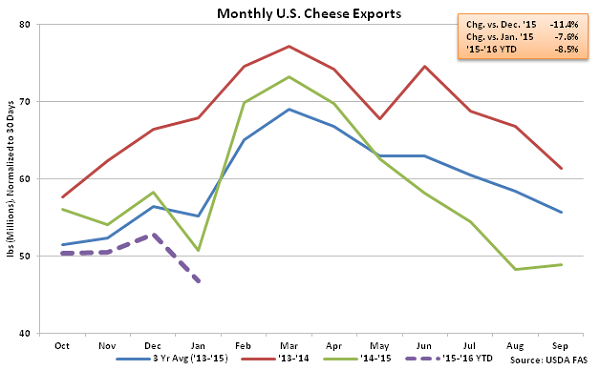
 Cheese – Export Volumes Decline to New Three Year Low, Finish Down 7.6% YOY
Jan ’16 U.S. cheese export volumes declined 11.4% MOM on a daily average basis while also remaining lower on a YOY basis, finishing down 7.6% to a new three year low. U.S. cheese export volumes have declined on a YOY basis for 16 consecutive months through January. Cheddar cheese exports also remained weak, declining by 6.8% YOY. U.S. cheddar cheese prices have traded at a premium to international cheddar cheese prices for ten consecutive months through Jan ’16. Jan ’16 cheese volumes destined to Mexico increased on a YOY basis for the fourth time in the past five months, finishing up 29.5%, however shipments to South Korea and Japan remained lower, finishing 56.5% and 15.9% below the previous year, respectively. Cheese volumes destined to Mexico, South Korea and Japan consisted of over half of the total U.S. cheese shipments throughout the month. ’14-’15 annual total cheese exports finished down 14.1% YOY, with cheddar cheese exports finishing down 49.4% and other-than-cheddar cheese finishing down 4.6%. ’15-’16 YTD cheese exports have declined an additional 8.5% throughout the first third of the production season.
Cheese – Export Volumes Decline to New Three Year Low, Finish Down 7.6% YOY
Jan ’16 U.S. cheese export volumes declined 11.4% MOM on a daily average basis while also remaining lower on a YOY basis, finishing down 7.6% to a new three year low. U.S. cheese export volumes have declined on a YOY basis for 16 consecutive months through January. Cheddar cheese exports also remained weak, declining by 6.8% YOY. U.S. cheddar cheese prices have traded at a premium to international cheddar cheese prices for ten consecutive months through Jan ’16. Jan ’16 cheese volumes destined to Mexico increased on a YOY basis for the fourth time in the past five months, finishing up 29.5%, however shipments to South Korea and Japan remained lower, finishing 56.5% and 15.9% below the previous year, respectively. Cheese volumes destined to Mexico, South Korea and Japan consisted of over half of the total U.S. cheese shipments throughout the month. ’14-’15 annual total cheese exports finished down 14.1% YOY, with cheddar cheese exports finishing down 49.4% and other-than-cheddar cheese finishing down 4.6%. ’15-’16 YTD cheese exports have declined an additional 8.5% throughout the first third of the production season.
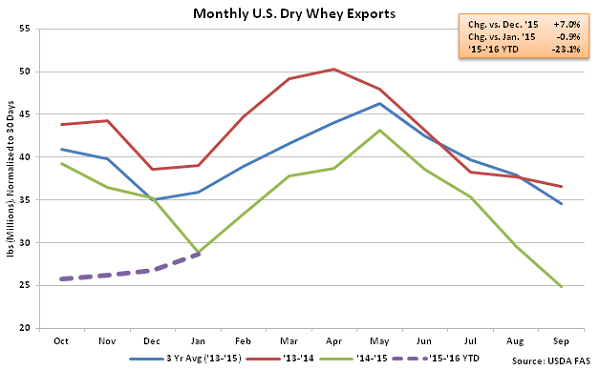
 Dry Whey – Export Volumes Remain Lower on YOY Basis for 20th Consecutive Month
Jan ’16 dry whey export volumes continued to increase slightly from the 11 year low experienced in Sep ’15 but finished lower on a YOY basis for the 20th consecutive month, declining by 0.9% to an eight year low for the month of January. Dry whey export volumes have increased MOM on a daily average basis for four consecutive months through Jan ’16, however monthly volumes exported from Sep ’15 – Jan ’16 remain at a seven year low. ’14-’15 annual dry whey exports finished down 18.0% YOY to a new 11 year low while ’15-’16 YTD dry whey exports have declined an additional 23.1% throughout the first third of the production season.
Dry Whey – Export Volumes Remain Lower on YOY Basis for 20th Consecutive Month
Jan ’16 dry whey export volumes continued to increase slightly from the 11 year low experienced in Sep ’15 but finished lower on a YOY basis for the 20th consecutive month, declining by 0.9% to an eight year low for the month of January. Dry whey export volumes have increased MOM on a daily average basis for four consecutive months through Jan ’16, however monthly volumes exported from Sep ’15 – Jan ’16 remain at a seven year low. ’14-’15 annual dry whey exports finished down 18.0% YOY to a new 11 year low while ’15-’16 YTD dry whey exports have declined an additional 23.1% throughout the first third of the production season.
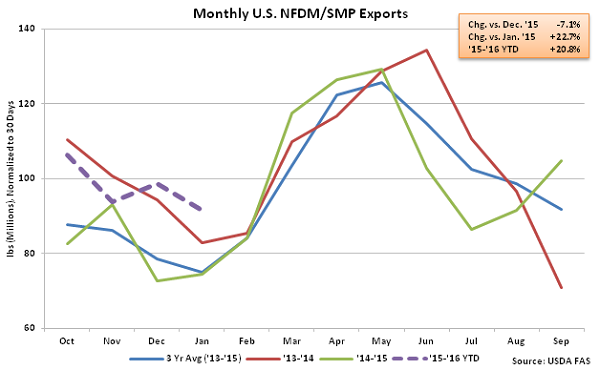
 NFDM/SMP – Export Volumes Remain Higher on YOY Basis for Fifth Consecutive Month
Jan ’16 export volumes of NFDM/SMP finished higher on a YOY basis for the fifth consecutive month, finishing up 22.7% to a new record high for the month of January. Jan ’16 NFDM/SMP volumes destined to Vietnam increased most significantly on a YOY basis, followed by shipments to the Philippines, Indonesia and Mexico. U.S. NDFM/SMP export volumes to Mexico increased 24.1% YOY throughout 2015 while export volumes shipped to all other destinations declined by 10.1% over the same period. ’14-’15 annual NFDM/SMP exports finished down 6.1% YOY however volumes are up 20.8% YOY throughout the first third of the ’15-’16 production season.
NFDM/SMP – Export Volumes Remain Higher on YOY Basis for Fifth Consecutive Month
Jan ’16 export volumes of NFDM/SMP finished higher on a YOY basis for the fifth consecutive month, finishing up 22.7% to a new record high for the month of January. Jan ’16 NFDM/SMP volumes destined to Vietnam increased most significantly on a YOY basis, followed by shipments to the Philippines, Indonesia and Mexico. U.S. NDFM/SMP export volumes to Mexico increased 24.1% YOY throughout 2015 while export volumes shipped to all other destinations declined by 10.1% over the same period. ’14-’15 annual NFDM/SMP exports finished down 6.1% YOY however volumes are up 20.8% YOY throughout the first third of the ’15-’16 production season.
 Jan ’16 U.S. cheese and dry whey exports as a percentage of production remained lower than the previous year, however U.S. butterfat exports as a percentage of production finished slightly ahead of the previous year while NFDM/SMP exports as a percentage of production finished higher on a YOY basis for the fifth consecutive month.
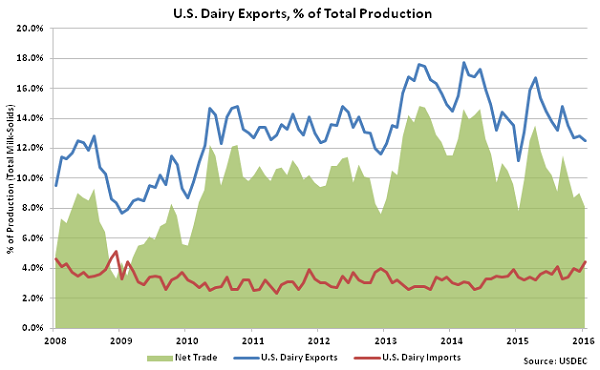
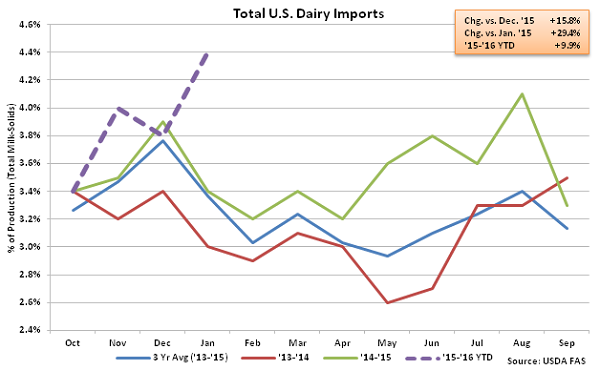
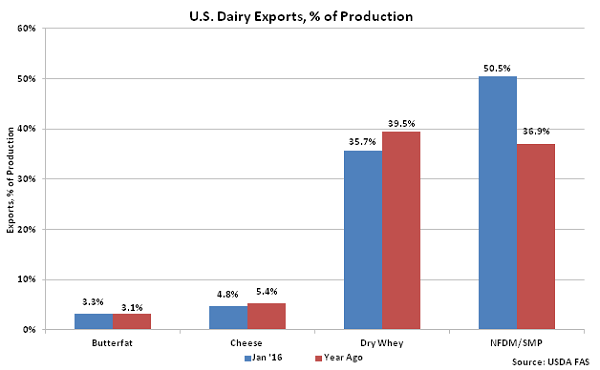 Overall, U.S. dairy export volumes were equivalent to 12.5% of total U.S. milk solids production in Jan ’16 while dairy import volumes were equivalent to approximately 4.4% of total U.S. milk solids production. Export volumes as a percent of total U.S. milk solids production reached a 12 month low while import volumes were the largest experienced in nearly seven years.
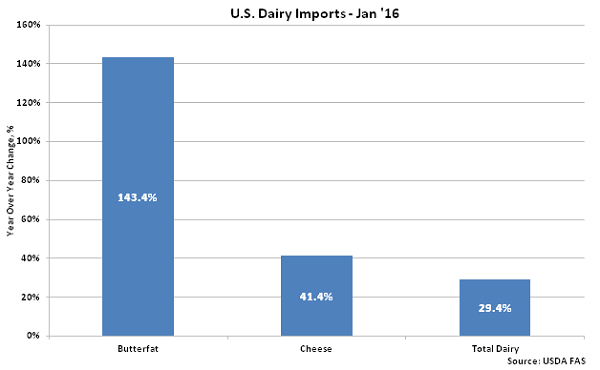
 U.S. butterfat and cheese import volumes continue to outpace overall dairy import volumes on a YOY percentage basis, increasing by 143.4% YOY and 41.4% YOY, respectively during Jan ’16, compared to a 29.4% YOY increase in the total value of all dairy import volumes.
Butter – U.S. Remains a Net Importer of Butter for 12th Consecutive Month
Jan ’16 export volumes of butterfat continued to increase off of the eight and a half year low experienced in Sep ’15, finishing higher on a YOY basis for the first time in 21 months. Jan ’16 butterfat export volumes increased 1.4% YOY and 35.3% MOM on a daily average basis, however butterfat imports continued to exceed export volumes throughout the month. The U.S. was a net importer of butter for the 12th consecutive month during Jan ’16, as total butterfat import volumes exceeded butterfat export volumes by nearly 60% throughout the month.
U.S. butter prices have traded at a premium to Europe and New Zealand butter prices when adjusted to 80% butterfat since May ’14, reducing export demand. The U.S. / international butter price spread reached an 11 year high during Nov ’15 prior to declining but remained at a significant premium throughout more recent months. ’14-’15 annual butterfat exports finished down 69.9% YOY while annual butterfat imports finished up 172.5% YOY.
Overall, ’14-’15 annual U.S. butterfat imports reached a new nine year high. ’15-’16 YTD butterfat imports have increased an additional 29.9% throughout the first third of the production season, while butter exports have declined 41.7% YOY over the same period. Growth in butterfat imports over the past 12 months has been led by product shipped from New Zealand, followed by imports of butterfat from Ireland, Mexico and France.
Cheese – Export Volumes Decline to New Three Year Low, Finish Down 7.6% YOY
Jan ’16 U.S. cheese export volumes declined 11.4% MOM on a daily average basis while also remaining lower on a YOY basis, finishing down 7.6% to a new three year low. U.S. cheese export volumes have declined on a YOY basis for 16 consecutive months through January. Cheddar cheese exports also remained weak, declining by 6.8% YOY. U.S. cheddar cheese prices have traded at a premium to international cheddar cheese prices for ten consecutive months through Jan ’16. Jan ’16 cheese volumes destined to Mexico increased on a YOY basis for the fourth time in the past five months, finishing up 29.5%, however shipments to South Korea and Japan remained lower, finishing 56.5% and 15.9% below the previous year, respectively. Cheese volumes destined to Mexico, South Korea and Japan consisted of over half of the total U.S. cheese shipments throughout the month. ’14-’15 annual total cheese exports finished down 14.1% YOY, with cheddar cheese exports finishing down 49.4% and other-than-cheddar cheese finishing down 4.6%. ’15-’16 YTD cheese exports have declined an additional 8.5% throughout the first third of the production season.
Dry Whey – Export Volumes Remain Lower on YOY Basis for 20th Consecutive Month
Jan ’16 dry whey export volumes continued to increase slightly from the 11 year low experienced in Sep ’15 but finished lower on a YOY basis for the 20th consecutive month, declining by 0.9% to an eight year low for the month of January. Dry whey export volumes have increased MOM on a daily average basis for four consecutive months through Jan ’16, however monthly volumes exported from Sep ’15 – Jan ’16 remain at a seven year low. ’14-’15 annual dry whey exports finished down 18.0% YOY to a new 11 year low while ’15-’16 YTD dry whey exports have declined an additional 23.1% throughout the first third of the production season.
NFDM/SMP – Export Volumes Remain Higher on YOY Basis for Fifth Consecutive Month
Jan ’16 export volumes of NFDM/SMP finished higher on a YOY basis for the fifth consecutive month, finishing up 22.7% to a new record high for the month of January. Jan ’16 NFDM/SMP volumes destined to Vietnam increased most significantly on a YOY basis, followed by shipments to the Philippines, Indonesia and Mexico. U.S. NDFM/SMP export volumes to Mexico increased 24.1% YOY throughout 2015 while export volumes shipped to all other destinations declined by 10.1% over the same period. ’14-’15 annual NFDM/SMP exports finished down 6.1% YOY however volumes are up 20.8% YOY throughout the first third of the ’15-’16 production season.
Jan ’16 U.S. cheese and dry whey exports as a percentage of production remained lower than the previous year, however U.S. butterfat exports as a percentage of production finished slightly ahead of the previous year while NFDM/SMP exports as a percentage of production finished higher on a YOY basis for the fifth consecutive month.
Overall, U.S. dairy export volumes were equivalent to 12.5% of total U.S. milk solids production in Jan ’16 while dairy import volumes were equivalent to approximately 4.4% of total U.S. milk solids production. Export volumes as a percent of total U.S. milk solids production reached a 12 month low while import volumes were the largest experienced in nearly seven years.
U.S. butterfat and cheese import volumes continue to outpace overall dairy import volumes on a YOY percentage basis, increasing by 143.4% YOY and 41.4% YOY, respectively during Jan ’16, compared to a 29.4% YOY increase in the total value of all dairy import volumes.