U.S. Milk Production Update – Jan ’16
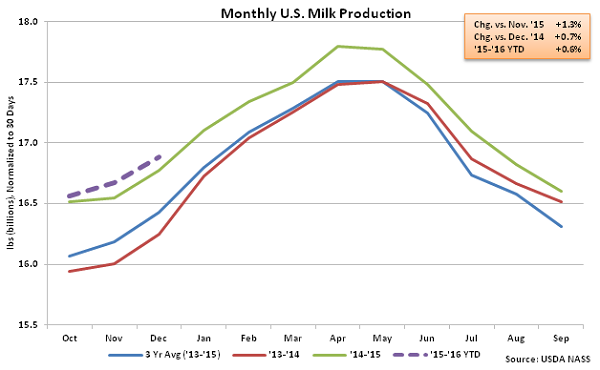
According to USDA, Dec ’15 U.S. milk production was up 0.7% YOY, at 17.4 billion pounds, setting a new December production record. Production also increased MOM, finishing 1.3% higher on a daily average basis. The MOM increase was consistent with the ten year average November – December seasonal increase of 1.3%.
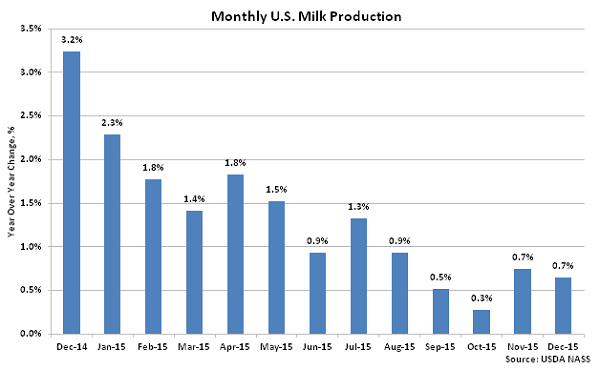
 U.S. milk production remained significantly higher on a YOY basis throughout the final months of 2014, however production growth has decelerated over of 2015. The Dec ’15 YOY growth rate of 0.7% finished above the 23 month low experienced in Oct ’15 but remained significantly below the ’14-’15 annual growth rate of 1.9%.
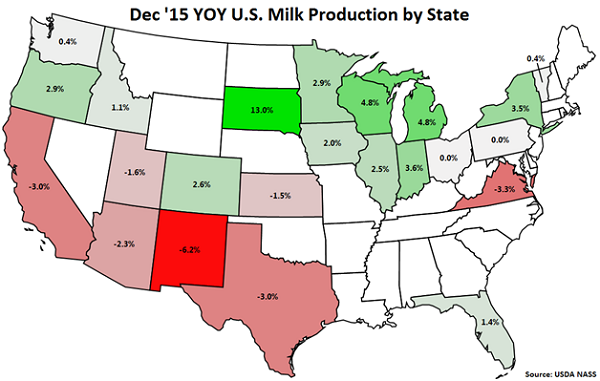
 YOY production gains on a percentage basis continue to be led by South Dakota (+13.0%), followed by Wisconsin (+4.8%) and Michigan (+4.8%). California milk production declined YOY for the 13th consecutive month, finishing 3.0% lower, while production in New Mexico, Virginia, Texas, Arizona, Utah and Kansas also finished lower than the previous year. New Mexico production (-6.2%) led all declines as Winter Storm Goliath brought in heavy snow and unseasonably cold weather over the final week of the month. California, New Mexico, Virginia, Texas, Arizona, Utah and Kansas experienced lower YOY milk per cow yields while California, New Mexico, Virginia, Texas and Kansas experienced reductions in their milk cow herds.
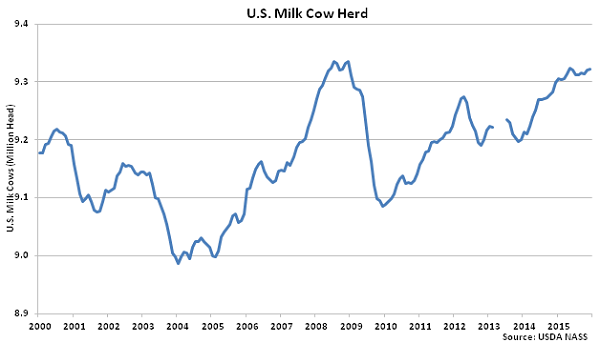
 Overall, the U.S. milk cow herd increased by 1,000 head MOM during Dec ’15, finishing at a seven month high. The total U.S. milk cow herd currently stands at 9,322,000 head, which is 23,000 head more than December of last year.
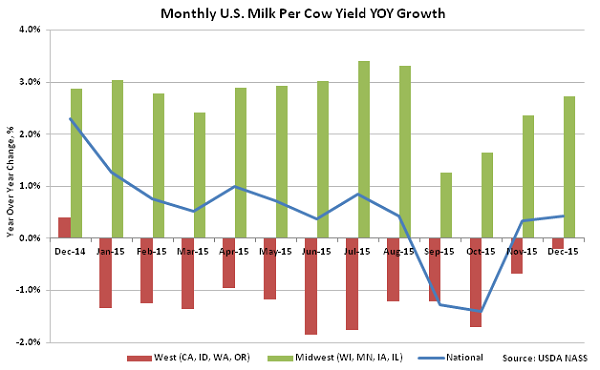
 The U.S. milk per cow yield increased YOY for the second consecutive month, finishing 0.4% higher than the previous year. Milk per cow yields continue to trend higher YOY in the Midwest, more than offsetting declining milk per cow yields in the Western United States. Milk per cow yields increased by an average of 2.7% YOY within Wisconsin, Minnesota, Iowa and Illinois while yields declined 0.2% YOY on average within California, Idaho, Washington and Oregon.
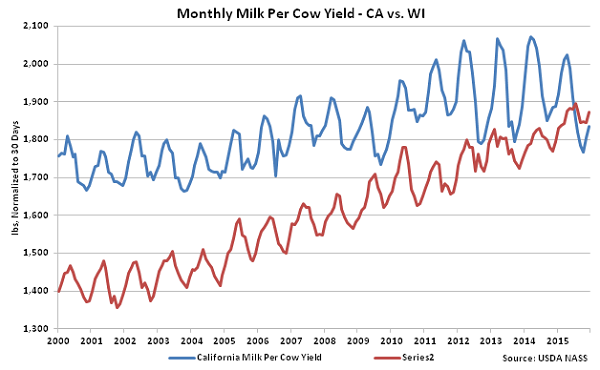
 Wisconsin milk per cow yields remained higher than California milk per cow yields for the sixth consecutive month during Dec ’15. California yields had finished higher than Wisconsin yields for 57 years prior to the past six months.
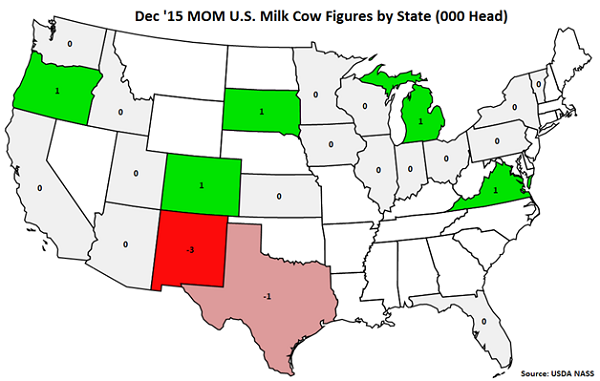
 MOM declines in the milk cow herd were exhibited in New Mexico (-3,000 head) and Texas (-1,000 head) as Winter Storm Goliath took a toll on dairy operations. MOM increases in the milk per herd were experienced in Wisconsin (+1,000 head), Oregon (+1,000 head), South Dakota (+1,000 head), Colorado (+1,000 head) and Virginia (+1,000 head).
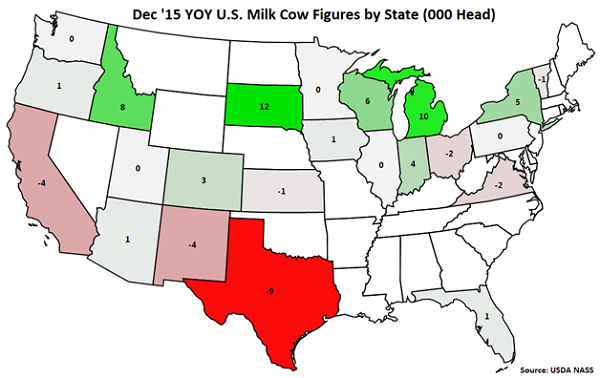
 YOY increases in milk cow herds were led by South Dakota (+12,000 head), followed by Michigan (+10,000 head) and Idaho (+8,000 head). Texas (-9,000 head), California (-4,000 head), New Mexico (-4,000 head), Virginia, (-2,000 head), Ohio (-2,000 head), Kansas (-1,000 head) and Vermont (-1,000 head) experienced YOY reductions in their milk cow herds.
U.S. milk production remained significantly higher on a YOY basis throughout the final months of 2014, however production growth has decelerated over of 2015. The Dec ’15 YOY growth rate of 0.7% finished above the 23 month low experienced in Oct ’15 but remained significantly below the ’14-’15 annual growth rate of 1.9%.
YOY production gains on a percentage basis continue to be led by South Dakota (+13.0%), followed by Wisconsin (+4.8%) and Michigan (+4.8%). California milk production declined YOY for the 13th consecutive month, finishing 3.0% lower, while production in New Mexico, Virginia, Texas, Arizona, Utah and Kansas also finished lower than the previous year. New Mexico production (-6.2%) led all declines as Winter Storm Goliath brought in heavy snow and unseasonably cold weather over the final week of the month. California, New Mexico, Virginia, Texas, Arizona, Utah and Kansas experienced lower YOY milk per cow yields while California, New Mexico, Virginia, Texas and Kansas experienced reductions in their milk cow herds.
Overall, the U.S. milk cow herd increased by 1,000 head MOM during Dec ’15, finishing at a seven month high. The total U.S. milk cow herd currently stands at 9,322,000 head, which is 23,000 head more than December of last year.
The U.S. milk per cow yield increased YOY for the second consecutive month, finishing 0.4% higher than the previous year. Milk per cow yields continue to trend higher YOY in the Midwest, more than offsetting declining milk per cow yields in the Western United States. Milk per cow yields increased by an average of 2.7% YOY within Wisconsin, Minnesota, Iowa and Illinois while yields declined 0.2% YOY on average within California, Idaho, Washington and Oregon.
Wisconsin milk per cow yields remained higher than California milk per cow yields for the sixth consecutive month during Dec ’15. California yields had finished higher than Wisconsin yields for 57 years prior to the past six months.
MOM declines in the milk cow herd were exhibited in New Mexico (-3,000 head) and Texas (-1,000 head) as Winter Storm Goliath took a toll on dairy operations. MOM increases in the milk per herd were experienced in Wisconsin (+1,000 head), Oregon (+1,000 head), South Dakota (+1,000 head), Colorado (+1,000 head) and Virginia (+1,000 head).
YOY increases in milk cow herds were led by South Dakota (+12,000 head), followed by Michigan (+10,000 head) and Idaho (+8,000 head). Texas (-9,000 head), California (-4,000 head), New Mexico (-4,000 head), Virginia, (-2,000 head), Ohio (-2,000 head), Kansas (-1,000 head) and Vermont (-1,000 head) experienced YOY reductions in their milk cow herds.