U.S. Commercial Disappearance Update – Oct ’15
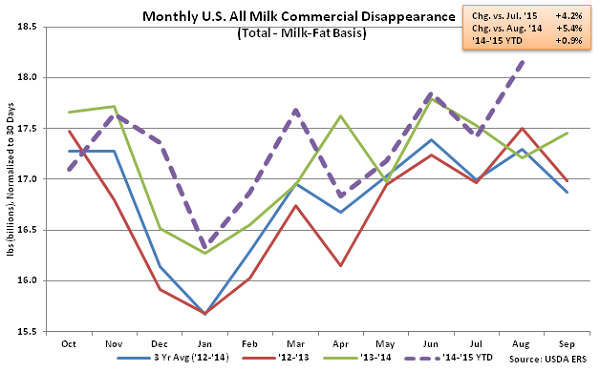
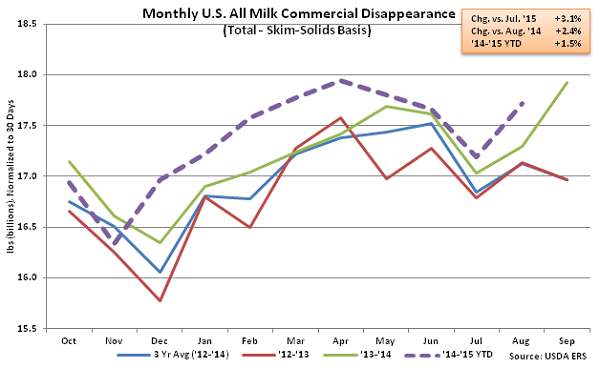
All Milk – Disappearance Reaches Record High on Milk-Fat Basis, Remains up YOY on Skim-Solids Basis
According to USDA, Aug ’15 U.S. commercial disappearance for milk used in all products increased to a new monthly record high on a milk-fat basis and set a new record high for the month of August on a skim-solids basis. Domestic demand continued to outpace international demand, finishing up 7.0% YOY on a milk-fat basis and 5.1% YOY on a skim-solids basis. ’14-’15 YTD commercial disappearance for milk used in all products is up 0.9% YOY on a milk-fat basis and 1.5% YOY on a skim-solids basis through the first 11 months of the production season, with domestic demand up 3.3% on a milk-fat basis and 3.2% on a skim-solids basis over the same period.
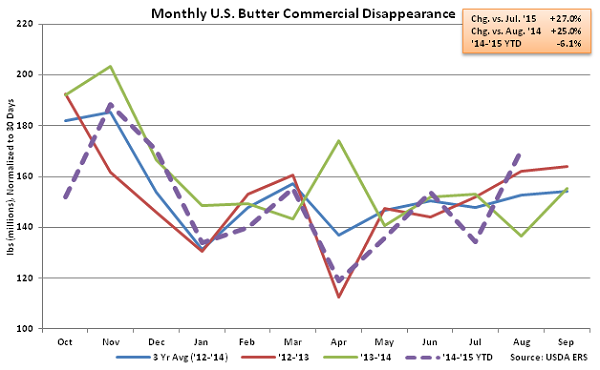
 Butter – Disappearance Increases to New Nine Month High, Record High for the Month of August
Aug ’15 U.S. butter commercial disappearance increased sharply, finishing up 25.0% YOY and 27.0% MOM on a daily average basis to a new nine month high and a record high for the month of August. Butter disappearance was markedly higher despite international demand continuing to remain weak. Aug ’15 domestic butter demand finished up 28.0% YOY while international demand declined 32.4% YOY. U.S. butterfat exports have declined YOY for 16 consecutive months as U.S. butter prices have traded at a premium to international prices and the U.S. Dollar has appreciated vs. rival currencies. Despite the significant increase in butter disappearance, ’14-’15 YTD U.S. butter commercial disappearance remains down 6.1% YOY through the first 11 months of the production season, with international demand down 74.5% but domestic demand up 1.1% over the period.
Butter – Disappearance Increases to New Nine Month High, Record High for the Month of August
Aug ’15 U.S. butter commercial disappearance increased sharply, finishing up 25.0% YOY and 27.0% MOM on a daily average basis to a new nine month high and a record high for the month of August. Butter disappearance was markedly higher despite international demand continuing to remain weak. Aug ’15 domestic butter demand finished up 28.0% YOY while international demand declined 32.4% YOY. U.S. butterfat exports have declined YOY for 16 consecutive months as U.S. butter prices have traded at a premium to international prices and the U.S. Dollar has appreciated vs. rival currencies. Despite the significant increase in butter disappearance, ’14-’15 YTD U.S. butter commercial disappearance remains down 6.1% YOY through the first 11 months of the production season, with international demand down 74.5% but domestic demand up 1.1% over the period.
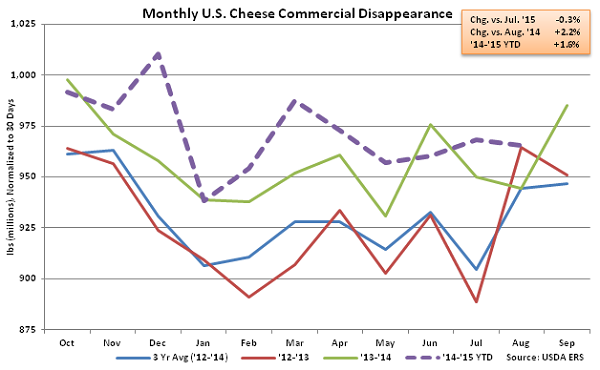
 Cheese – Disappearance Reaches Record High for the Month of August, Finishes up 2.2%
Aug ’15 U.S. cheese commercial disappearance declined 0.3% MOM on a daily average basis but increased 2.2% YOY to a new record high for the month of August. The YOY increase in cheese disappearance was the sixth experienced in the past seven months. Other-than-American cheese disappearance was particularly strong, increasing by 5.0% YOY while American cheese disappearance declined 2.0% YOY. Domestic cheese demand increased 4.5% YOY however export demand remained weak, declining 27.7% YOY. Cheese export volumes have declined YOY for 11 consecutive months while domestic demand has increased YOY for ten consecutive months. ’14-’15 YTD U.S. cheese commercial disappearance is up 1.6% YOY through the first 11 months of the production season.
Cheese – Disappearance Reaches Record High for the Month of August, Finishes up 2.2%
Aug ’15 U.S. cheese commercial disappearance declined 0.3% MOM on a daily average basis but increased 2.2% YOY to a new record high for the month of August. The YOY increase in cheese disappearance was the sixth experienced in the past seven months. Other-than-American cheese disappearance was particularly strong, increasing by 5.0% YOY while American cheese disappearance declined 2.0% YOY. Domestic cheese demand increased 4.5% YOY however export demand remained weak, declining 27.7% YOY. Cheese export volumes have declined YOY for 11 consecutive months while domestic demand has increased YOY for ten consecutive months. ’14-’15 YTD U.S. cheese commercial disappearance is up 1.6% YOY through the first 11 months of the production season.
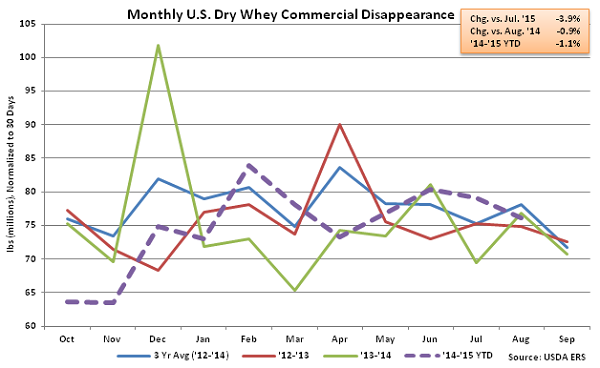
 Dry Whey – Disappearance Declines 0.9% YOY as Export Demand Remains Weak
Aug ’15 U.S. dry whey commercial disappearance declined 0.9% YOY and 3.9% MOM on a daily average basis. Domestic dry whey commercial disappearance remained strong, increasing YOY for the eighth consecutive month and finishing 19.1% above the previous year, however U.S. dry whey export demand remains weak, finishing down 21.5% YOY. ’14-’15 YTD U.S. dry whey commercial disappearance is down 1.1% YOY through the first 11 months of the production season, with international demand down 16.8% but domestic demand up 19.7% over the period.
Dry Whey – Disappearance Declines 0.9% YOY as Export Demand Remains Weak
Aug ’15 U.S. dry whey commercial disappearance declined 0.9% YOY and 3.9% MOM on a daily average basis. Domestic dry whey commercial disappearance remained strong, increasing YOY for the eighth consecutive month and finishing 19.1% above the previous year, however U.S. dry whey export demand remains weak, finishing down 21.5% YOY. ’14-’15 YTD U.S. dry whey commercial disappearance is down 1.1% YOY through the first 11 months of the production season, with international demand down 16.8% but domestic demand up 19.7% over the period.
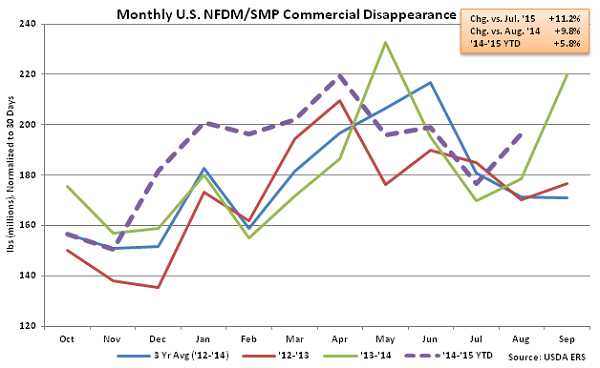
 NFDM/SMP – Disappearance Reaches Record High for the Month of August, Finishes up 9.8%
Aug ’15 U.S. NFDM/SMP commercial disappearance increased 9.8% YOY and 11.2% MOM on a daily average basis to a new record high for the month of August. Domestic NFDM/SMP commercial disappearance remained particularly strong, increasing 27.7% YOY. The YOY gains in domestic commercial disappearance outweighed the 5.4% YOY decline in U.S. NFDM/SMP exports. ’14-’15 YTD U.S. NFDM/SMP commercial disappearance is up 5.8% YOY through the first 11 months of the production season despite export volumes declining 7.9% YOY over the same period.
NFDM/SMP – Disappearance Reaches Record High for the Month of August, Finishes up 9.8%
Aug ’15 U.S. NFDM/SMP commercial disappearance increased 9.8% YOY and 11.2% MOM on a daily average basis to a new record high for the month of August. Domestic NFDM/SMP commercial disappearance remained particularly strong, increasing 27.7% YOY. The YOY gains in domestic commercial disappearance outweighed the 5.4% YOY decline in U.S. NFDM/SMP exports. ’14-’15 YTD U.S. NFDM/SMP commercial disappearance is up 5.8% YOY through the first 11 months of the production season despite export volumes declining 7.9% YOY over the same period.
 Fluid Milk Sales – Fat-Reduced Sales Continue to Weigh Down Overall Figures
Aug ’15 U.S. fluid milk sales of 4.04 billion pounds declined YOY for the 19th time in the past 20 months, finishing 1.3% below the previous year. Total fluid milk sales increased seasonally from the record low monthly sales reached in Jul ’15 but remained at a record low for the month of August. Sales of whole milk remained strong, finishing up 4.3% YOY, while fat-reduced milk sales declined 3.6% YOY. ’14-’15 YTD total fluid milk sales are down 2.1% YOY through the first 11 months of the production season.
Fluid Milk Sales – Fat-Reduced Sales Continue to Weigh Down Overall Figures
Aug ’15 U.S. fluid milk sales of 4.04 billion pounds declined YOY for the 19th time in the past 20 months, finishing 1.3% below the previous year. Total fluid milk sales increased seasonally from the record low monthly sales reached in Jul ’15 but remained at a record low for the month of August. Sales of whole milk remained strong, finishing up 4.3% YOY, while fat-reduced milk sales declined 3.6% YOY. ’14-’15 YTD total fluid milk sales are down 2.1% YOY through the first 11 months of the production season.
 See the table below for a summary of key Aug ’15 U.S. dairy commercial disappearance figures in addition to the Aug ’15 U.S. fluid milk sales figure.

Butter – Disappearance Increases to New Nine Month High, Record High for the Month of August
Aug ’15 U.S. butter commercial disappearance increased sharply, finishing up 25.0% YOY and 27.0% MOM on a daily average basis to a new nine month high and a record high for the month of August. Butter disappearance was markedly higher despite international demand continuing to remain weak. Aug ’15 domestic butter demand finished up 28.0% YOY while international demand declined 32.4% YOY. U.S. butterfat exports have declined YOY for 16 consecutive months as U.S. butter prices have traded at a premium to international prices and the U.S. Dollar has appreciated vs. rival currencies. Despite the significant increase in butter disappearance, ’14-’15 YTD U.S. butter commercial disappearance remains down 6.1% YOY through the first 11 months of the production season, with international demand down 74.5% but domestic demand up 1.1% over the period.
Cheese – Disappearance Reaches Record High for the Month of August, Finishes up 2.2%
Aug ’15 U.S. cheese commercial disappearance declined 0.3% MOM on a daily average basis but increased 2.2% YOY to a new record high for the month of August. The YOY increase in cheese disappearance was the sixth experienced in the past seven months. Other-than-American cheese disappearance was particularly strong, increasing by 5.0% YOY while American cheese disappearance declined 2.0% YOY. Domestic cheese demand increased 4.5% YOY however export demand remained weak, declining 27.7% YOY. Cheese export volumes have declined YOY for 11 consecutive months while domestic demand has increased YOY for ten consecutive months. ’14-’15 YTD U.S. cheese commercial disappearance is up 1.6% YOY through the first 11 months of the production season.
Dry Whey – Disappearance Declines 0.9% YOY as Export Demand Remains Weak
Aug ’15 U.S. dry whey commercial disappearance declined 0.9% YOY and 3.9% MOM on a daily average basis. Domestic dry whey commercial disappearance remained strong, increasing YOY for the eighth consecutive month and finishing 19.1% above the previous year, however U.S. dry whey export demand remains weak, finishing down 21.5% YOY. ’14-’15 YTD U.S. dry whey commercial disappearance is down 1.1% YOY through the first 11 months of the production season, with international demand down 16.8% but domestic demand up 19.7% over the period.
NFDM/SMP – Disappearance Reaches Record High for the Month of August, Finishes up 9.8%
Aug ’15 U.S. NFDM/SMP commercial disappearance increased 9.8% YOY and 11.2% MOM on a daily average basis to a new record high for the month of August. Domestic NFDM/SMP commercial disappearance remained particularly strong, increasing 27.7% YOY. The YOY gains in domestic commercial disappearance outweighed the 5.4% YOY decline in U.S. NFDM/SMP exports. ’14-’15 YTD U.S. NFDM/SMP commercial disappearance is up 5.8% YOY through the first 11 months of the production season despite export volumes declining 7.9% YOY over the same period.
Fluid Milk Sales – Fat-Reduced Sales Continue to Weigh Down Overall Figures
Aug ’15 U.S. fluid milk sales of 4.04 billion pounds declined YOY for the 19th time in the past 20 months, finishing 1.3% below the previous year. Total fluid milk sales increased seasonally from the record low monthly sales reached in Jul ’15 but remained at a record low for the month of August. Sales of whole milk remained strong, finishing up 4.3% YOY, while fat-reduced milk sales declined 3.6% YOY. ’14-’15 YTD total fluid milk sales are down 2.1% YOY through the first 11 months of the production season.
See the table below for a summary of key Aug ’15 U.S. dairy commercial disappearance figures in addition to the Aug ’15 U.S. fluid milk sales figure.