U.S. Dairy Cold Storage Update – Mar ’20
Executive Summary
U.S. cold storage figures provided by the USDA were recently updated with values spanning through Feb ’20. Highlights from the updated report include:
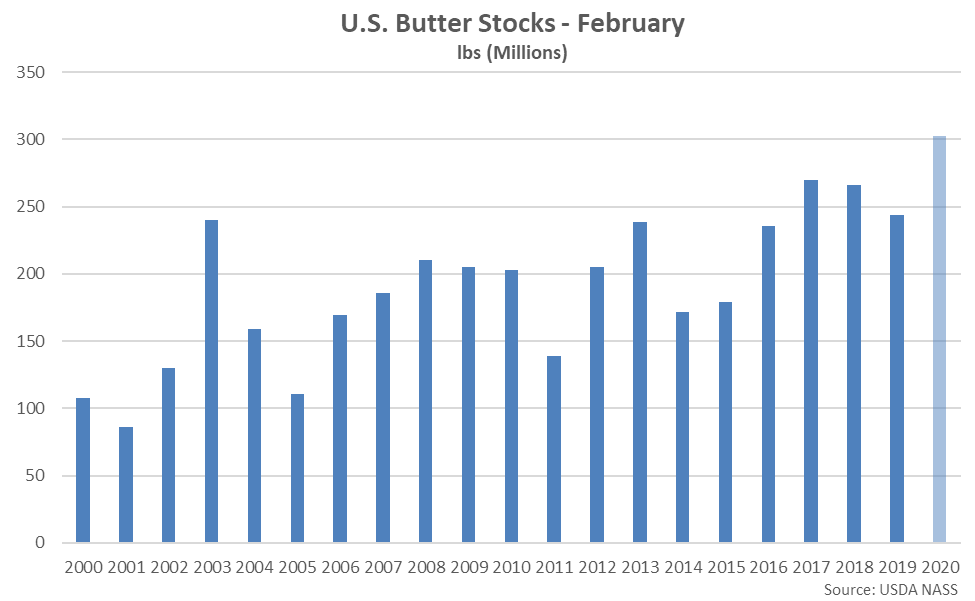
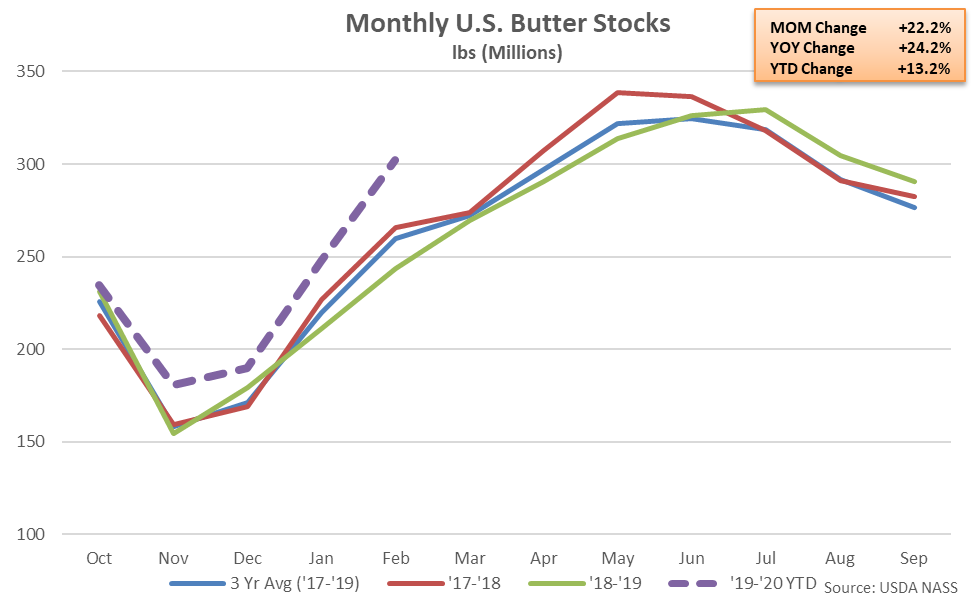 According to the USDA, Feb ’20 U.S. butter stocks increased seasonally to a six month high level while remaining higher on a YOY basis for the eighth consecutive month, finishing up 24.2% to a 27 year seasonal high level. The YOY increase in butter stocks was the largest experienced throughout the past three years on a percentage basis. The MOM increase in butter stocks of 55.0 million pounds, or 22.2%, was larger than the ten year average January – February seasonal build of 34.2 million pounds, or 19.0%. The MOM increase in butter stocks was in addition to a 1.9% upward revision to the January stocks figure. The seasonal increase in butter stocks was the largest experienced throughout the past 28 years, despite the upward revision to previous month figures. Butter stocks typically reach seasonal low levels throughout the months of November and December, prior to increasing throughout the first half of the calendar year.
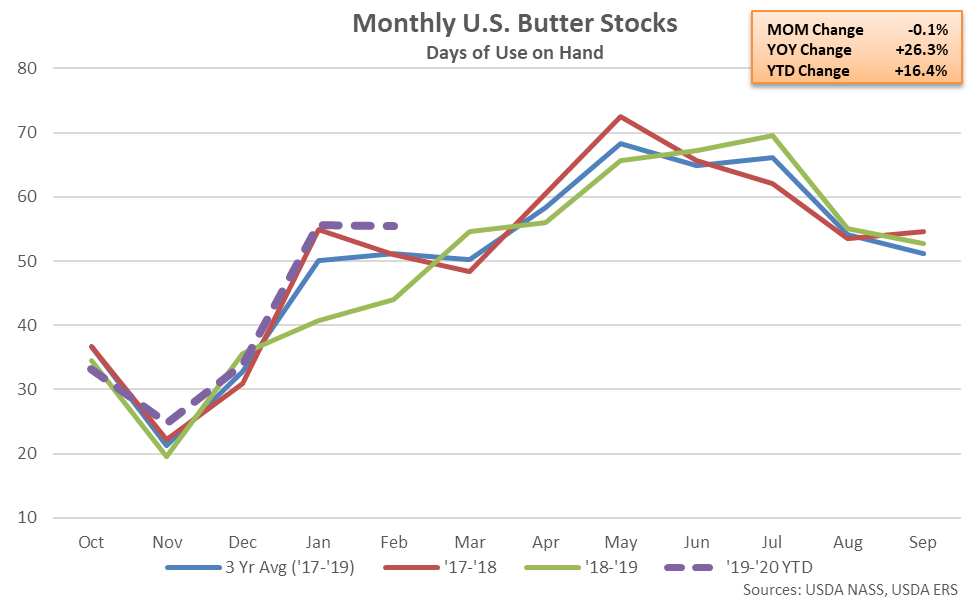
 On a days of usage basis, Feb ’20 U.S. butter stocks also finished higher YOY. When assuming 12-month rolling average YOY changes in usage rates and known stock values for the month of February, butter stocks on a days of usage basis increased YOY for the third time in the past four months, finishing up 26.3%.
 Cheese – Stocks Remain Lower YOY for the Eighth Time in Nine Months, Finish Down 0.5% YOY
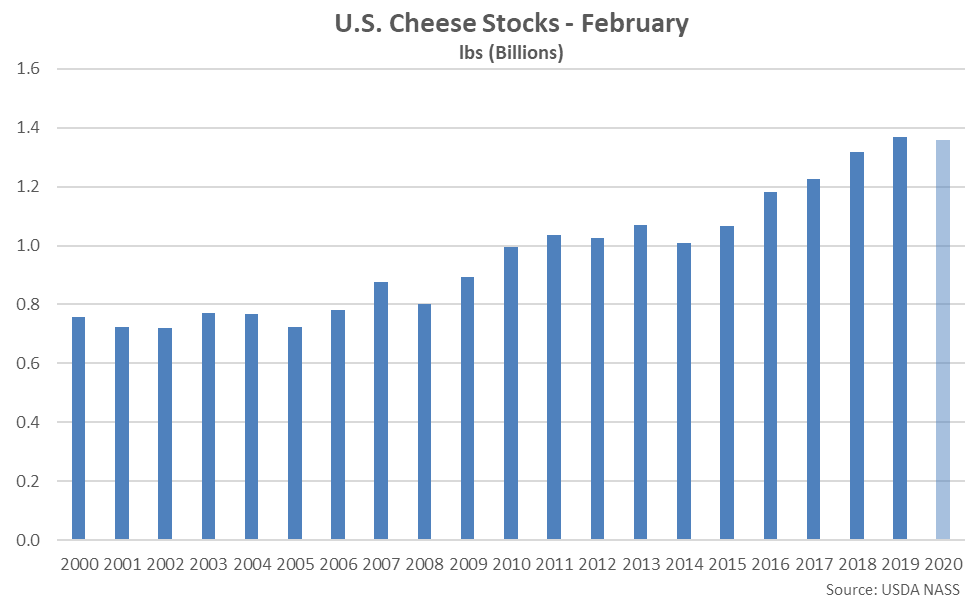
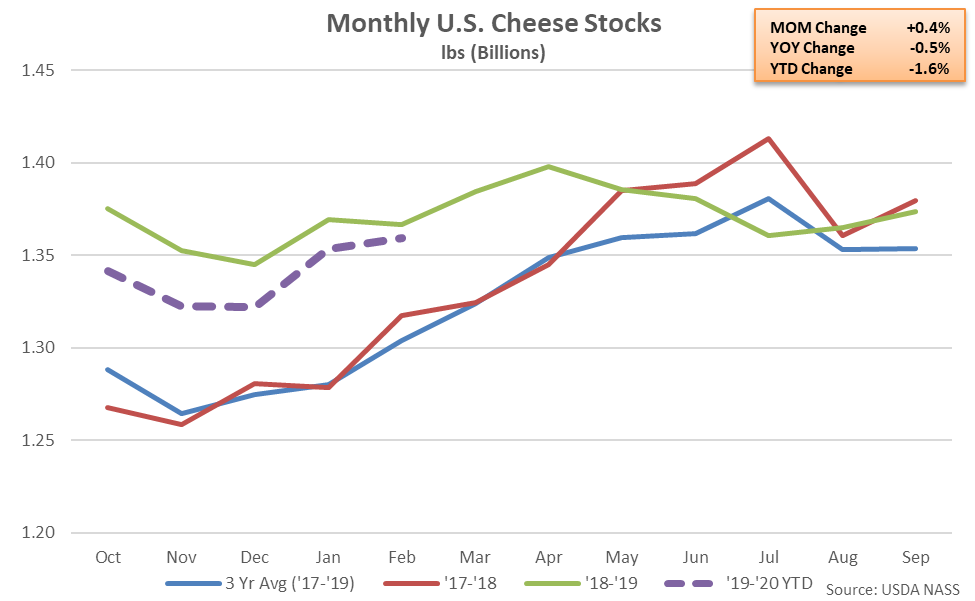 Feb ’20 U.S. cheese stocks continued to rebound seasonally but remained 0.5% lower on a YOY basis. The YOY decline in cheese stocks was the eighth experienced throughout the past nine months but the smallest experienced throughout the past five months on a percentage basis. Despite declining on a YOY basis, Feb ’20 U.S. cheese stocks remained 4.3% above three year average seasonal levels. American cheese stocks declined 0.6% YOY throughout the month while other-than-American cheese stocks finished 0.5% lower on a YOY basis. The MOM increase in cheese stocks of 6.0 million pounds, or 0.4%, was smaller than the ten year average January – February seasonal build of 12.9 million pounds, or 1.1%.
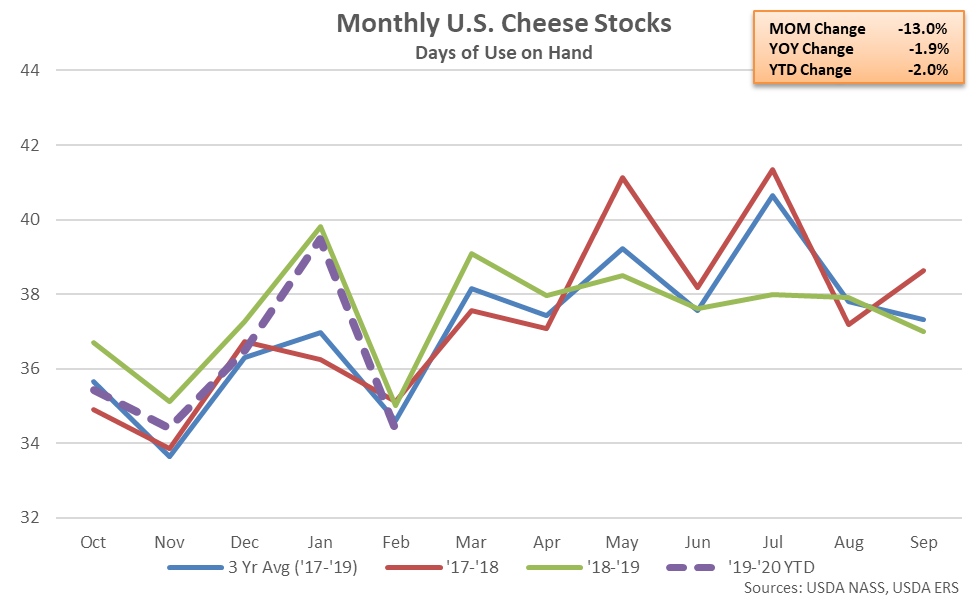
 On a days of usage basis, Feb ’20 U.S. cheese stocks also remained lower YOY. When assuming 12-month rolling average YOY changes in usage rates and known stock values for the month of February, cheese stocks on a days of usage basis declined YOY for the sixth consecutive month, finishing down 1.9%.
 Combined Dairy Product Stocks – Stocks Rebound to a Record High Seasonal Level
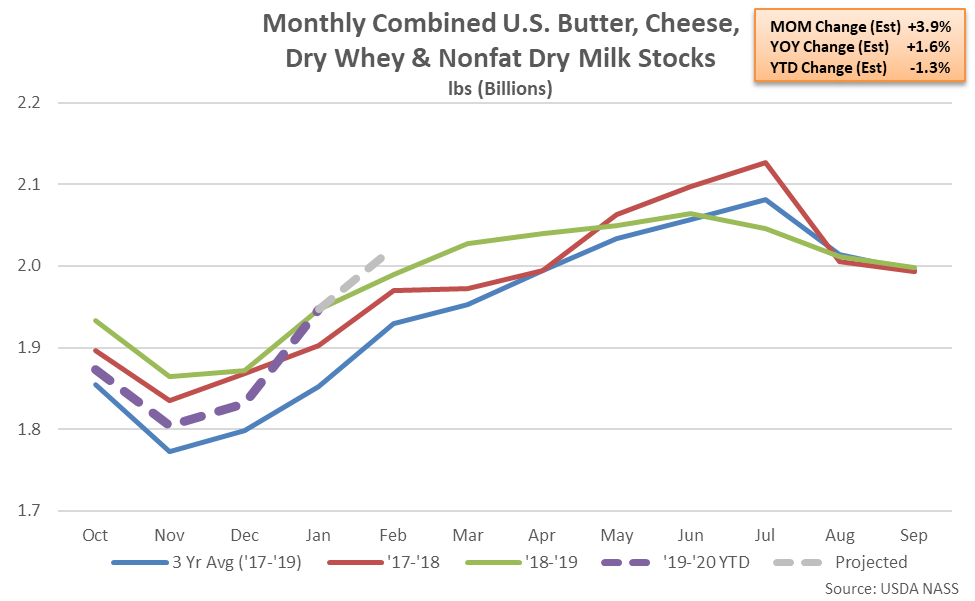 Combined stocks of butter, cheese, dry whey and nonfat dry milk finished slightly higher on a YOY basis during Jan ’20 on the upward revision in butter stocks. Combined dairy product stocks reached a record high seasonal level, finishing 5.1% above three year average seasonal figures.
Combined stocks of butter, cheese, dry whey and NFDM are projected to remain at a record high seasonal level throughout Feb ’20 when using actual butter and cheese stock figures and previous month YOY changes in dry whey and NFDM stocks, increasing by an estimated 1.6%. Feb ’20 dry whey and NFDM stock figures are scheduled to be available April 2nd.
Combined stocks of butter, cheese, dry whey and nonfat dry milk finished slightly higher on a YOY basis during Jan ’20 on the upward revision in butter stocks. Combined dairy product stocks reached a record high seasonal level, finishing 5.1% above three year average seasonal figures.
Combined stocks of butter, cheese, dry whey and NFDM are projected to remain at a record high seasonal level throughout Feb ’20 when using actual butter and cheese stock figures and previous month YOY changes in dry whey and NFDM stocks, increasing by an estimated 1.6%. Feb ’20 dry whey and NFDM stock figures are scheduled to be available April 2nd.
- U.S. butter stocks remained higher on a YOY basis for the eighth consecutive month during Feb ’20, finishing up 24.2% and reaching a 27 year seasonal high level. The YOY increase in butter stocks was the largest experienced throughout the past three years on a percentage basis.
- Feb ’20 U.S. cheese stocks remained lower on a YOY basis for the eighth time in the past nine months, finishing down 0.5%. Cheese stocks remained 4.3% above three year average seasonal levels, however.
According to the USDA, Feb ’20 U.S. butter stocks increased seasonally to a six month high level while remaining higher on a YOY basis for the eighth consecutive month, finishing up 24.2% to a 27 year seasonal high level. The YOY increase in butter stocks was the largest experienced throughout the past three years on a percentage basis. The MOM increase in butter stocks of 55.0 million pounds, or 22.2%, was larger than the ten year average January – February seasonal build of 34.2 million pounds, or 19.0%. The MOM increase in butter stocks was in addition to a 1.9% upward revision to the January stocks figure. The seasonal increase in butter stocks was the largest experienced throughout the past 28 years, despite the upward revision to previous month figures. Butter stocks typically reach seasonal low levels throughout the months of November and December, prior to increasing throughout the first half of the calendar year.
On a days of usage basis, Feb ’20 U.S. butter stocks also finished higher YOY. When assuming 12-month rolling average YOY changes in usage rates and known stock values for the month of February, butter stocks on a days of usage basis increased YOY for the third time in the past four months, finishing up 26.3%.
Cheese – Stocks Remain Lower YOY for the Eighth Time in Nine Months, Finish Down 0.5% YOY
Feb ’20 U.S. cheese stocks continued to rebound seasonally but remained 0.5% lower on a YOY basis. The YOY decline in cheese stocks was the eighth experienced throughout the past nine months but the smallest experienced throughout the past five months on a percentage basis. Despite declining on a YOY basis, Feb ’20 U.S. cheese stocks remained 4.3% above three year average seasonal levels. American cheese stocks declined 0.6% YOY throughout the month while other-than-American cheese stocks finished 0.5% lower on a YOY basis. The MOM increase in cheese stocks of 6.0 million pounds, or 0.4%, was smaller than the ten year average January – February seasonal build of 12.9 million pounds, or 1.1%.
On a days of usage basis, Feb ’20 U.S. cheese stocks also remained lower YOY. When assuming 12-month rolling average YOY changes in usage rates and known stock values for the month of February, cheese stocks on a days of usage basis declined YOY for the sixth consecutive month, finishing down 1.9%.
Combined Dairy Product Stocks – Stocks Rebound to a Record High Seasonal Level
Combined stocks of butter, cheese, dry whey and nonfat dry milk finished slightly higher on a YOY basis during Jan ’20 on the upward revision in butter stocks. Combined dairy product stocks reached a record high seasonal level, finishing 5.1% above three year average seasonal figures.
Combined stocks of butter, cheese, dry whey and NFDM are projected to remain at a record high seasonal level throughout Feb ’20 when using actual butter and cheese stock figures and previous month YOY changes in dry whey and NFDM stocks, increasing by an estimated 1.6%. Feb ’20 dry whey and NFDM stock figures are scheduled to be available April 2nd.