Soybean Complex Crushing & Stocks Update – Nov ’19
Executive Summary
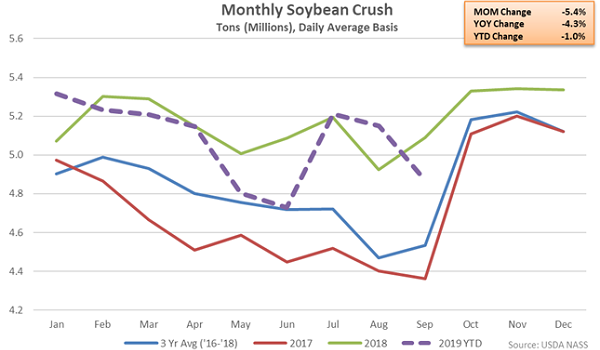
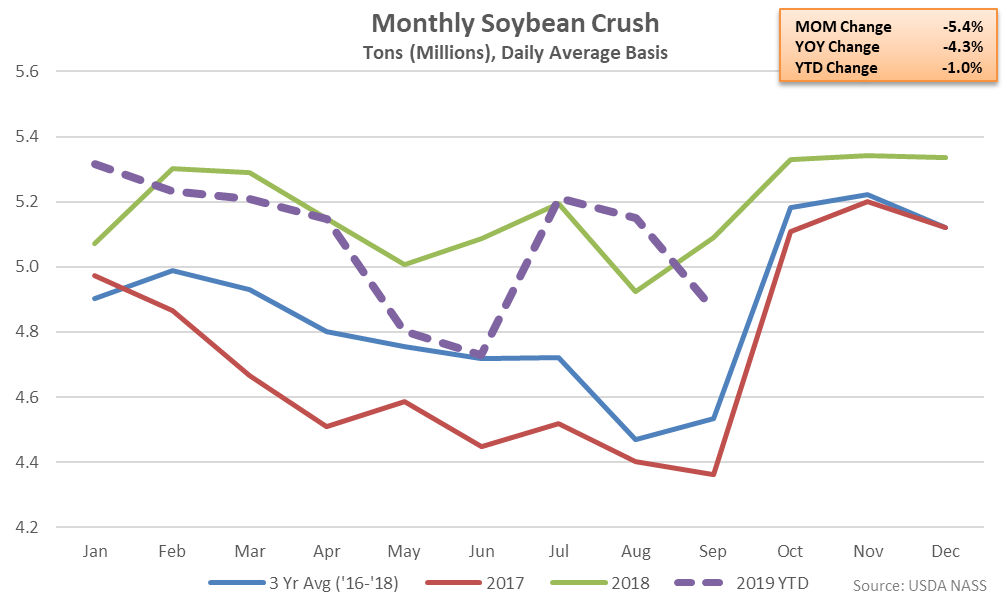
U.S. soybean crush and stocks figures provided by USDA were recently updated with values spanning through Sep ’19. Highlights from the updated report include:
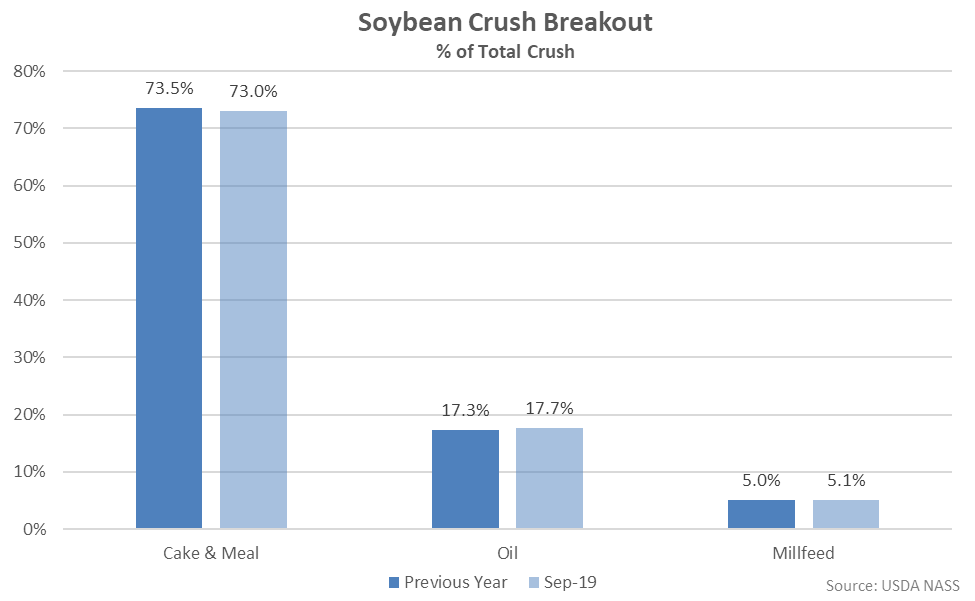
 Cake & Meal accounted for 73.0% of the total soybean crush throughout Sep ’19, down slightly from the previous year, while oil accounted for 17.7% of the total soybean crush, up slightly from the previous year.
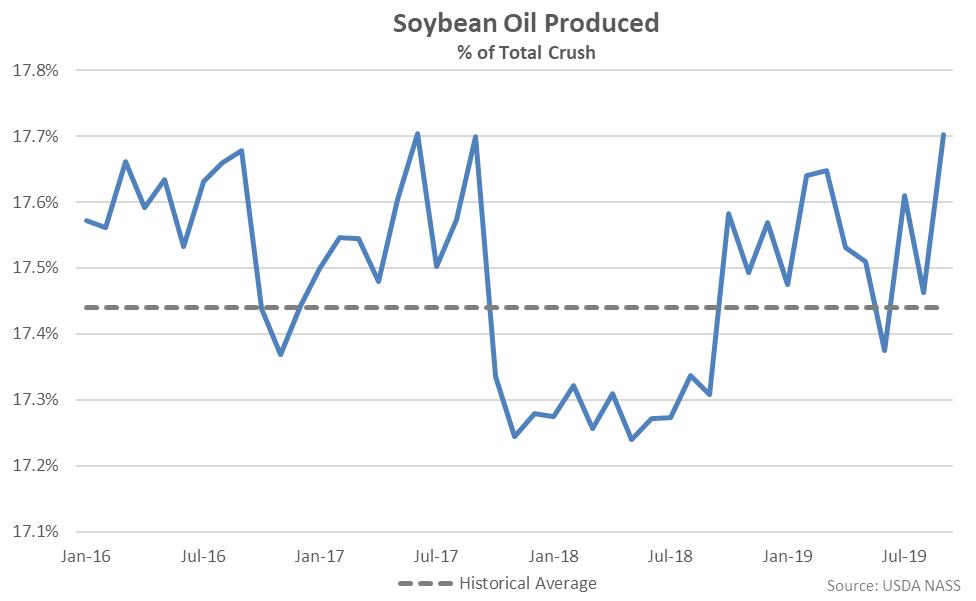
 Sep ’19 soybean oil produced as a percentage of total crush increased to a two year high level, finishing above historical average figures for the 11th time in the past 12 months.
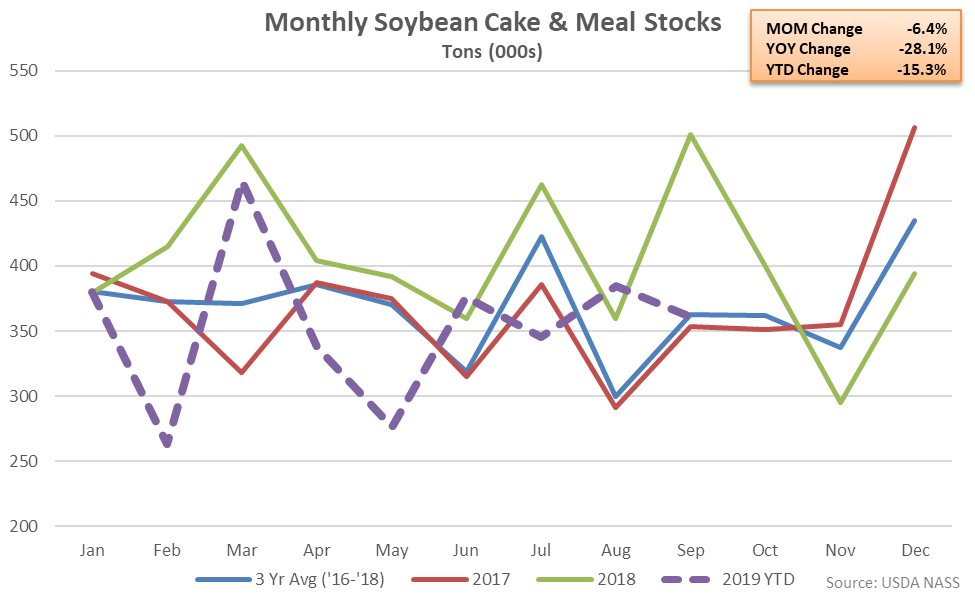
 Soybean Cake & Meal Stocks – Stocks Finish 28.1% Lower YOY
Sep ’19 U.S. soybean cake & meal stocks declined 6.4% MOM and 28.1% YOY, finishing lower on a YOY basis for the second time in the past three months. Soybean cake & meal stocks remained at the second highest seasonal level experienced throughout the past five years, however. The seasonal decline in soybean cake & meal stocks of 6.4% was a contraseasonal move when compared to the three year August – September seasonal average build in stocks of 18.4%.
Soybean Cake & Meal Stocks – Stocks Finish 28.1% Lower YOY
Sep ’19 U.S. soybean cake & meal stocks declined 6.4% MOM and 28.1% YOY, finishing lower on a YOY basis for the second time in the past three months. Soybean cake & meal stocks remained at the second highest seasonal level experienced throughout the past five years, however. The seasonal decline in soybean cake & meal stocks of 6.4% was a contraseasonal move when compared to the three year August – September seasonal average build in stocks of 18.4%.
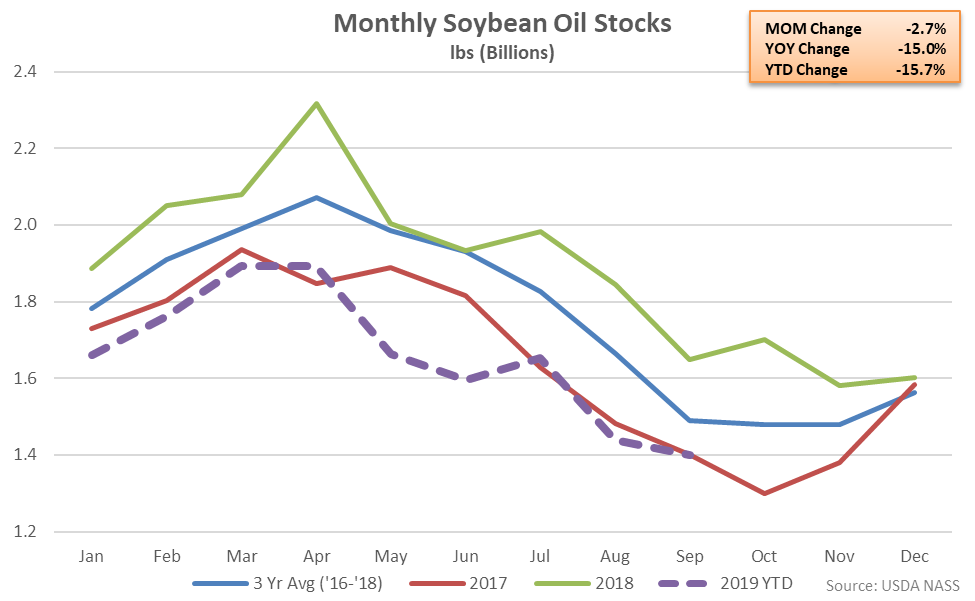
 Soybean Oil Stocks – Stocks Decline to a 22 Month Low, Finish Down 15.0% YOY
Sep ’19 U.S. soybean oil stocks declined 2.7% MOM to a 22 month low level, finishing 15.0% below previous year volumes and reaching a five year seasonal low level. The YOY decline in soybean oil stocks was the ninth experienced in a row but the smallest experienced throughout the past six months on a percentage basis. The seasonal decline in soybean oil stocks of 2.7% was smaller than the three year August – September seasonal average decline of 10.4%.
Soybean Oil Stocks – Stocks Decline to a 22 Month Low, Finish Down 15.0% YOY
Sep ’19 U.S. soybean oil stocks declined 2.7% MOM to a 22 month low level, finishing 15.0% below previous year volumes and reaching a five year seasonal low level. The YOY decline in soybean oil stocks was the ninth experienced in a row but the smallest experienced throughout the past six months on a percentage basis. The seasonal decline in soybean oil stocks of 2.7% was smaller than the three year August – September seasonal average decline of 10.4%.
- Sep ’19 U.S. soybean crushings declined on a YOY basis for the first time in the past three months, finishing down 4.3% but remaining at the second highest seasonal level experienced throughout the past five years.
- Sep ’19 U.S. soybean cake & meal stocks declined 28.1% YOY but remained at the second highest seasonal level experienced throughout the past five years.
- Sep ’19 U.S. soybean oil stocks declined to a 22 month low level, finishing 15.0% below previous year volumes and reaching a five year seasonal low.
Cake & Meal accounted for 73.0% of the total soybean crush throughout Sep ’19, down slightly from the previous year, while oil accounted for 17.7% of the total soybean crush, up slightly from the previous year.
Sep ’19 soybean oil produced as a percentage of total crush increased to a two year high level, finishing above historical average figures for the 11th time in the past 12 months.
Soybean Cake & Meal Stocks – Stocks Finish 28.1% Lower YOY
Sep ’19 U.S. soybean cake & meal stocks declined 6.4% MOM and 28.1% YOY, finishing lower on a YOY basis for the second time in the past three months. Soybean cake & meal stocks remained at the second highest seasonal level experienced throughout the past five years, however. The seasonal decline in soybean cake & meal stocks of 6.4% was a contraseasonal move when compared to the three year August – September seasonal average build in stocks of 18.4%.
Soybean Oil Stocks – Stocks Decline to a 22 Month Low, Finish Down 15.0% YOY
Sep ’19 U.S. soybean oil stocks declined 2.7% MOM to a 22 month low level, finishing 15.0% below previous year volumes and reaching a five year seasonal low level. The YOY decline in soybean oil stocks was the ninth experienced in a row but the smallest experienced throughout the past six months on a percentage basis. The seasonal decline in soybean oil stocks of 2.7% was smaller than the three year August – September seasonal average decline of 10.4%.