U.S. Per Capita Dairy Consumption Update – Feb ’21
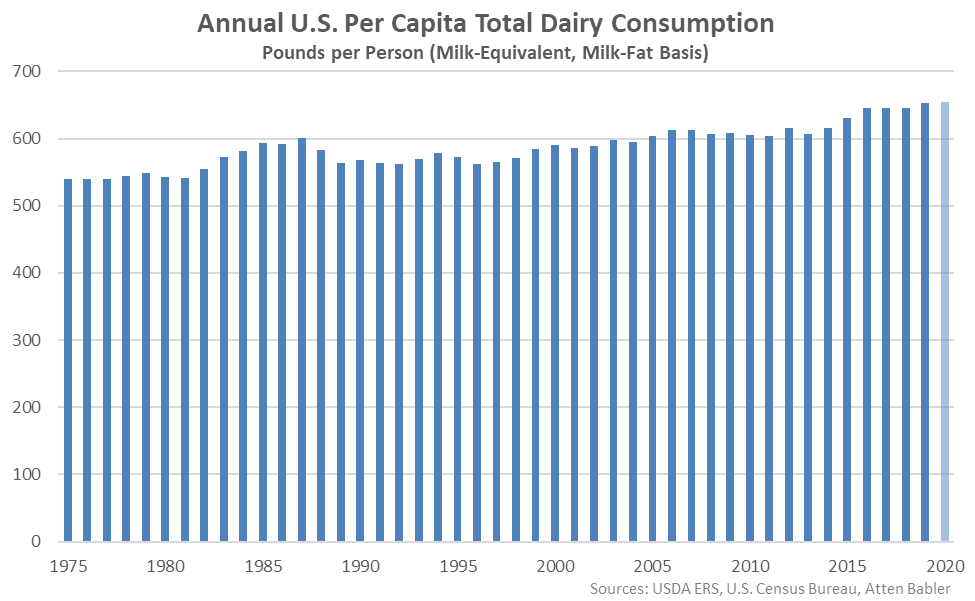
Domestic per capita consumption of dairy products on a milk-equivalent, milk-fat basis increased 0.2% on a YOY basis throughout 2020, reaching a record high level. The YOY increase in consumption rates was the sixth experienced throughout the past seven years.
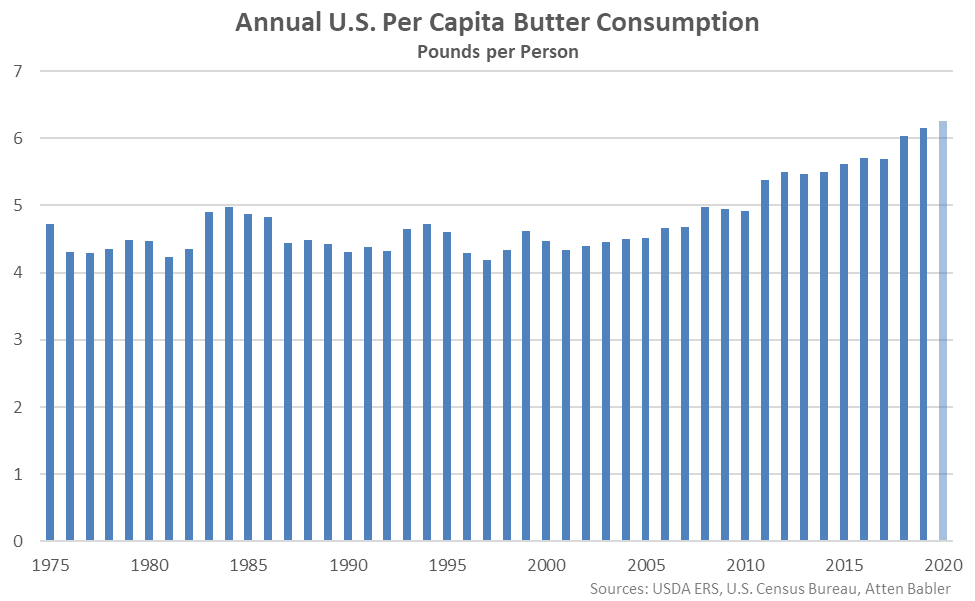
Domestic per capita butter consumption reached a record high level throughout 2020, finishing 1.5% higher on a YOY basis. Butter consumption increased to 6.3 pounds per person throughout 2020 based on monthly commercial disappearance and population figures.
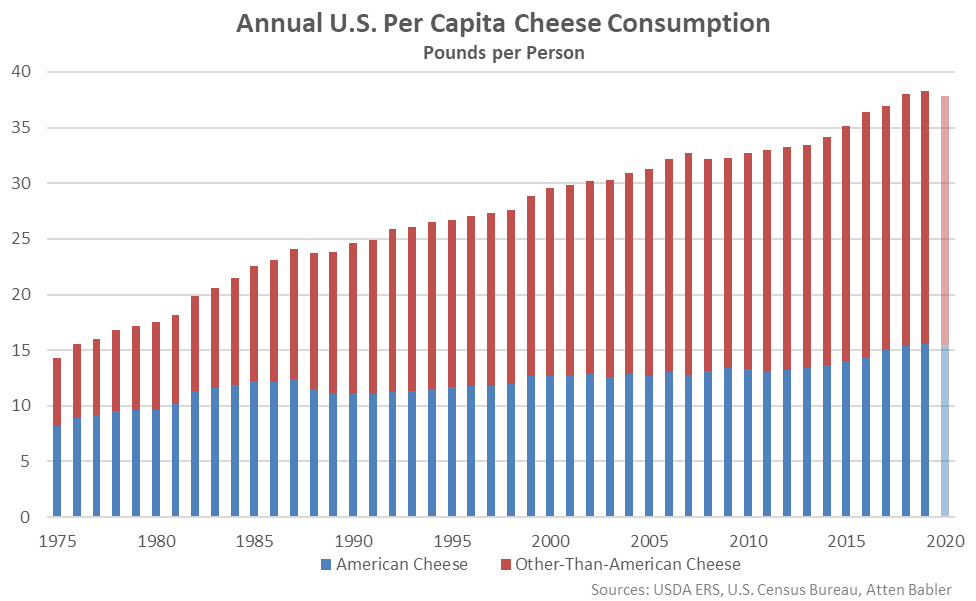
2020 domestic per capita cheese consumption declined from the record high level experienced throughout the previous year, finishing 1.3% lower on a YOY basis. Cheese consumption declined to a three year low level of 37.8 pounds per person throughout 2020 based on monthly commercial disappearance and population figures. Per capita American cheese consumption declined 0.3% on a YOY basis throughout 2020 while per capita other-than-American cheese declined by 2.0%.
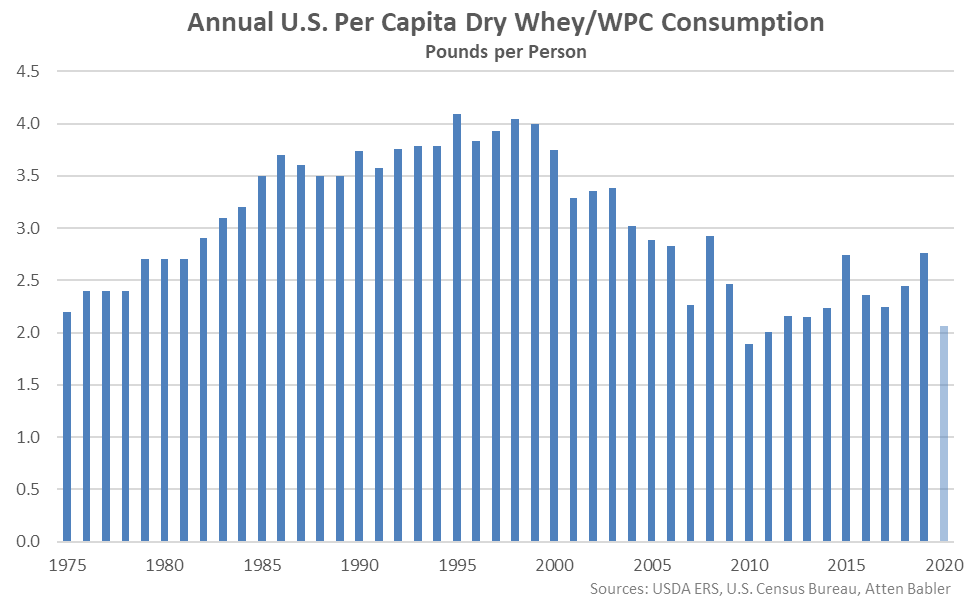
Domestic per capita dry whey and whey protein concentrate consumption declined to a nine year low level throughout 2020, finishing 25.4% lower on a YOY basis. Dry whey and whey protein concentrate consumption declined to 2.1 pounds per person throughout 2020 based on monthly commercial disappearance and population figures.
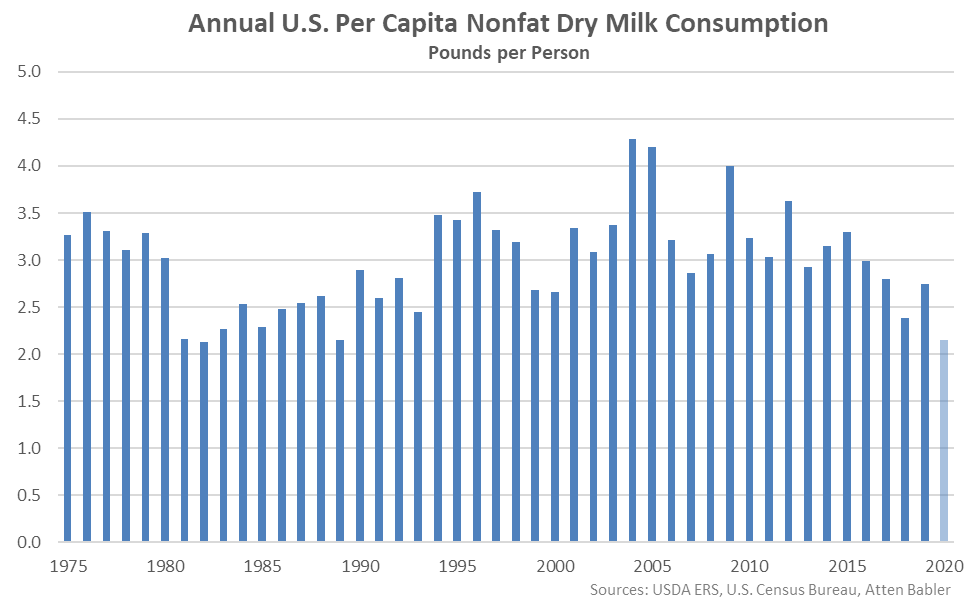
Domestic per capita nonfat dry milk consumption declined to a record low level throughout 2020, finishing 21.6% lower on a YOY basis. Nonfat dry milk consumption declined to 2.2 pounds per person throughout 2020 based on monthly commercial disappearance and population figures.
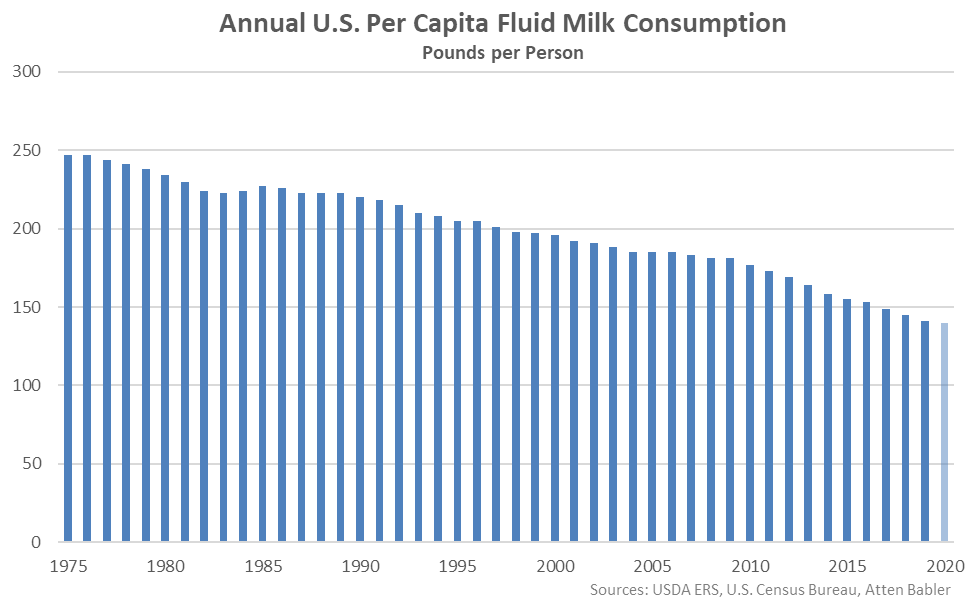
Domestic per capita fluid milk consumption declined 0.9% on a YOY basis throughout 2020, reaching the lowest level on record. Fluid milk consumption declined to 140 pounds per person throughout 2020 based on monthly fluid milk sales and population figures.
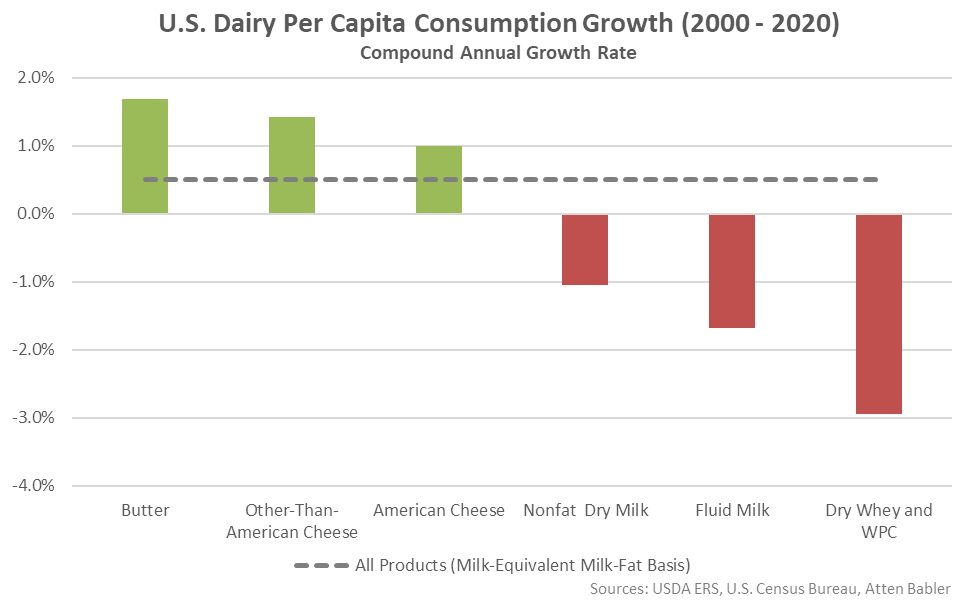
Since 2000, total U.S. per capita consumption of dairy products on a milk-equivalent, milk-fat basis has increased by a compound annual growth rate of 0.5%. Per capita butter consumption has increased most significantly throughout the period, followed closely by per capita cheese consumption, while per capita dry whey/whey protein concentrate, fluid milk, and nonfat dry milk consumption all finished lower.