Soybean Complex Crushing & Stocks Update – Dec ’20
Executive Summary
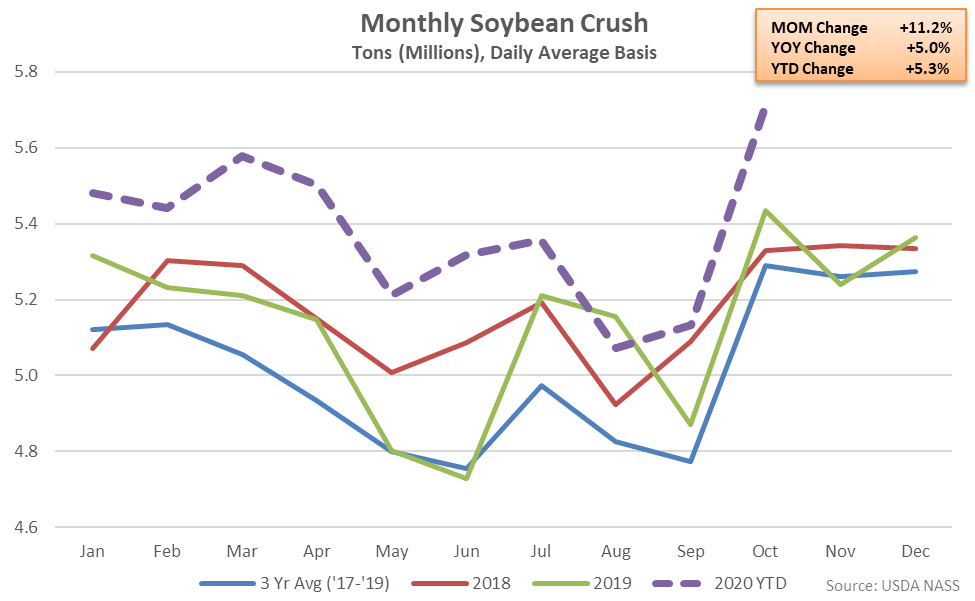
U.S. soybean crush and stocks figures provided by the USDA were recently updated with values spanning through Oct ’20. Highlights from the updated report include:
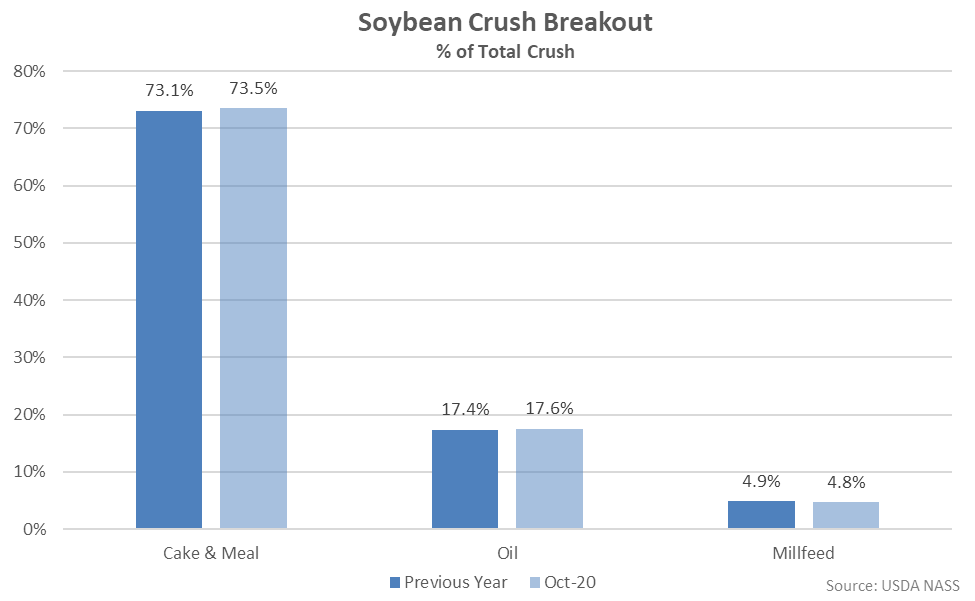
 Cake & meal accounted for 73.5% of the total soybean crush throughout Oct ’20, up slightly from the previous year, while oil accounted for 17.6% of the total soybean crush, also up slightly from the previous year.
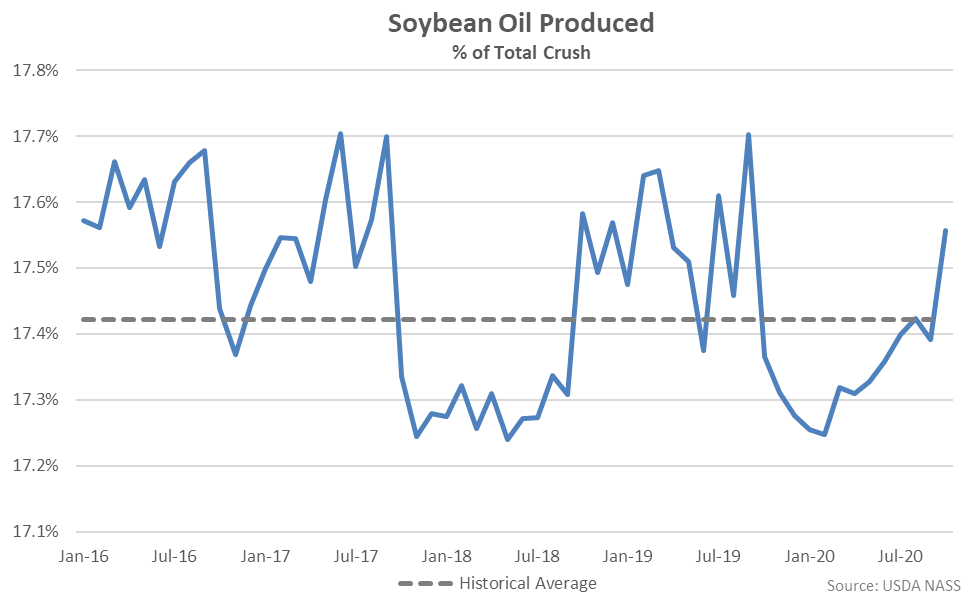
 Oct ’20 soybean oil produced as a percentage of total crush rebounded to a 13 month high level, finishing above historical average figures for just the second time in the 13 month period.
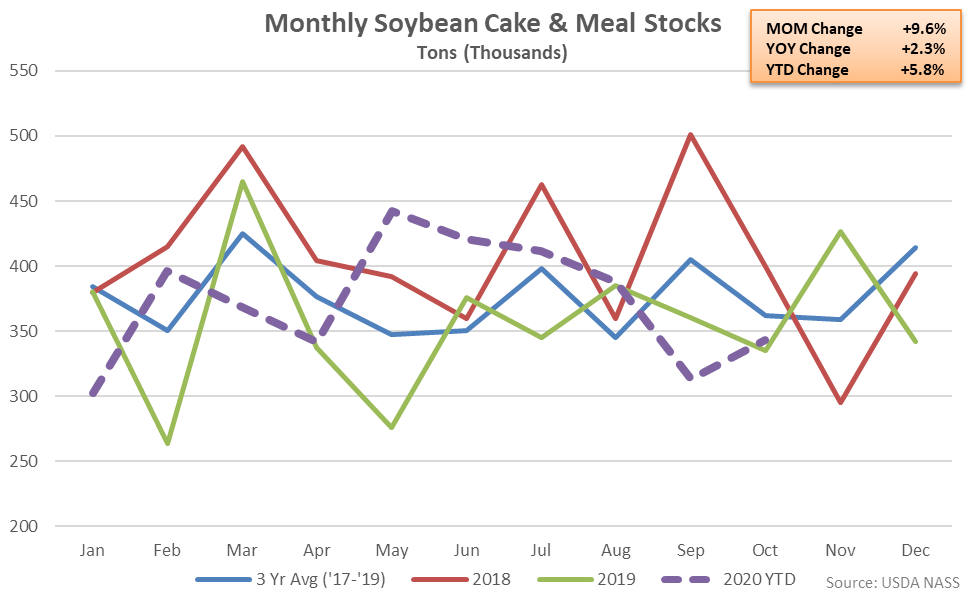
 Soybean Cake & Meal Stocks – Stocks Remain Higher YOY for the Sixth Time in Seven Months, up 2.3%
Oct ’20 U.S. soybean cake & meal stocks rebounded from the eight month low level experienced throughout the previous month while finishing 2.3% higher on a YOY basis. The YOY increase in soybean cake & meal stocks was the sixth experienced throughout the past seven months. The month-over-month increase in soybean cake & meal stocks of 9.6% was a contraseasonal move when compared to the three year average September – October seasonal decline in stocks of 9.4%. Despite finishing higher on a YOY basis, Oct ’20 soybean cake & meal stocks remained 5.2% below three year average seasonal levels.
Soybean Cake & Meal Stocks – Stocks Remain Higher YOY for the Sixth Time in Seven Months, up 2.3%
Oct ’20 U.S. soybean cake & meal stocks rebounded from the eight month low level experienced throughout the previous month while finishing 2.3% higher on a YOY basis. The YOY increase in soybean cake & meal stocks was the sixth experienced throughout the past seven months. The month-over-month increase in soybean cake & meal stocks of 9.6% was a contraseasonal move when compared to the three year average September – October seasonal decline in stocks of 9.4%. Despite finishing higher on a YOY basis, Oct ’20 soybean cake & meal stocks remained 5.2% below three year average seasonal levels.
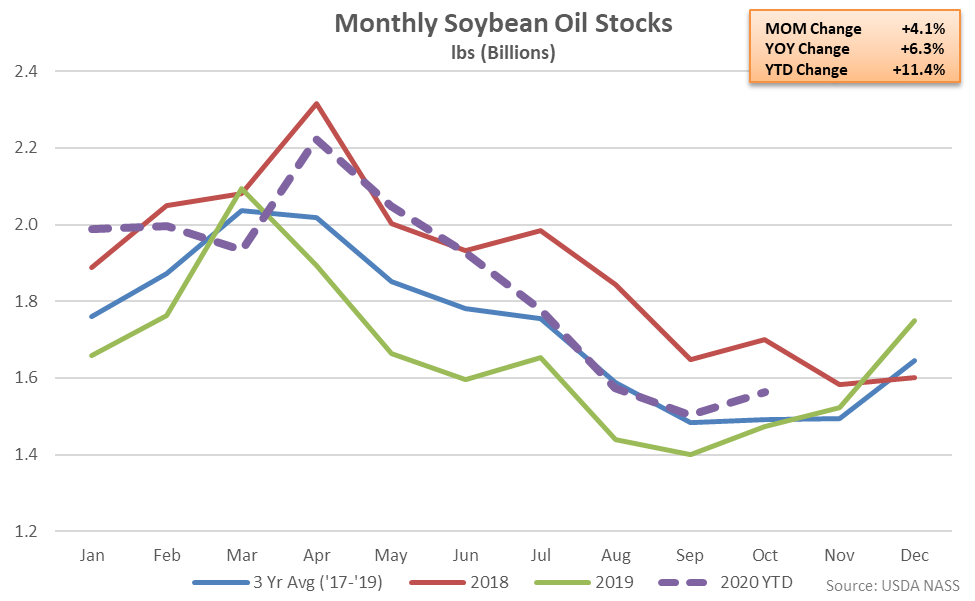
 Soybean Oil Stocks – Stocks Remain Higher YOY for the Tenth Time in 11 Months, up 6.3%
Oct ’20 U.S. soybean oil stocks rebounded seasonally from the 11 month low level experienced throughout the previous month while finishing 6.3% higher on a YOY basis. Soybean oil stocks had finished lower on a YOY basis throughout eight consecutive months through Nov ’19 prior to finishing higher throughout ten of the past 11 months. The month-over-month increase in soybean oil stocks of 4.1% was greater than the three year average September – October seasonal increase of 0.4%. Oct ’20 soybean oil stocks finished 4.9% above three year average seasonal levels, finishing higher for the tenth time in the past 11 months.
Soybean Oil Stocks – Stocks Remain Higher YOY for the Tenth Time in 11 Months, up 6.3%
Oct ’20 U.S. soybean oil stocks rebounded seasonally from the 11 month low level experienced throughout the previous month while finishing 6.3% higher on a YOY basis. Soybean oil stocks had finished lower on a YOY basis throughout eight consecutive months through Nov ’19 prior to finishing higher throughout ten of the past 11 months. The month-over-month increase in soybean oil stocks of 4.1% was greater than the three year average September – October seasonal increase of 0.4%. Oct ’20 soybean oil stocks finished 4.9% above three year average seasonal levels, finishing higher for the tenth time in the past 11 months.
- U.S. soybean crushings increased 5.0% on a YOY basis during Oct ’20, finishing higher for the tenth time in the past 11 months.
- U.S. soybean cake & meal stocks increased on a YOY basis for the sixth time in the past seven months during Oct ’20, finishing up 2.3%.
- U.S. soybean oil stocks remained higher on a YOY basis for the tenth time in the past 11 months, finishing up 6.3%.
Cake & meal accounted for 73.5% of the total soybean crush throughout Oct ’20, up slightly from the previous year, while oil accounted for 17.6% of the total soybean crush, also up slightly from the previous year.
Oct ’20 soybean oil produced as a percentage of total crush rebounded to a 13 month high level, finishing above historical average figures for just the second time in the 13 month period.
Soybean Cake & Meal Stocks – Stocks Remain Higher YOY for the Sixth Time in Seven Months, up 2.3%
Oct ’20 U.S. soybean cake & meal stocks rebounded from the eight month low level experienced throughout the previous month while finishing 2.3% higher on a YOY basis. The YOY increase in soybean cake & meal stocks was the sixth experienced throughout the past seven months. The month-over-month increase in soybean cake & meal stocks of 9.6% was a contraseasonal move when compared to the three year average September – October seasonal decline in stocks of 9.4%. Despite finishing higher on a YOY basis, Oct ’20 soybean cake & meal stocks remained 5.2% below three year average seasonal levels.
Soybean Oil Stocks – Stocks Remain Higher YOY for the Tenth Time in 11 Months, up 6.3%
Oct ’20 U.S. soybean oil stocks rebounded seasonally from the 11 month low level experienced throughout the previous month while finishing 6.3% higher on a YOY basis. Soybean oil stocks had finished lower on a YOY basis throughout eight consecutive months through Nov ’19 prior to finishing higher throughout ten of the past 11 months. The month-over-month increase in soybean oil stocks of 4.1% was greater than the three year average September – October seasonal increase of 0.4%. Oct ’20 soybean oil stocks finished 4.9% above three year average seasonal levels, finishing higher for the tenth time in the past 11 months.