Soybean Complex Crushing & Stocks Update – Nov ’20
Executive Summary
U.S. soybean crush and stocks figures provided by the USDA were recently updated with values spanning through Sep ’20. Highlights from the updated report include:
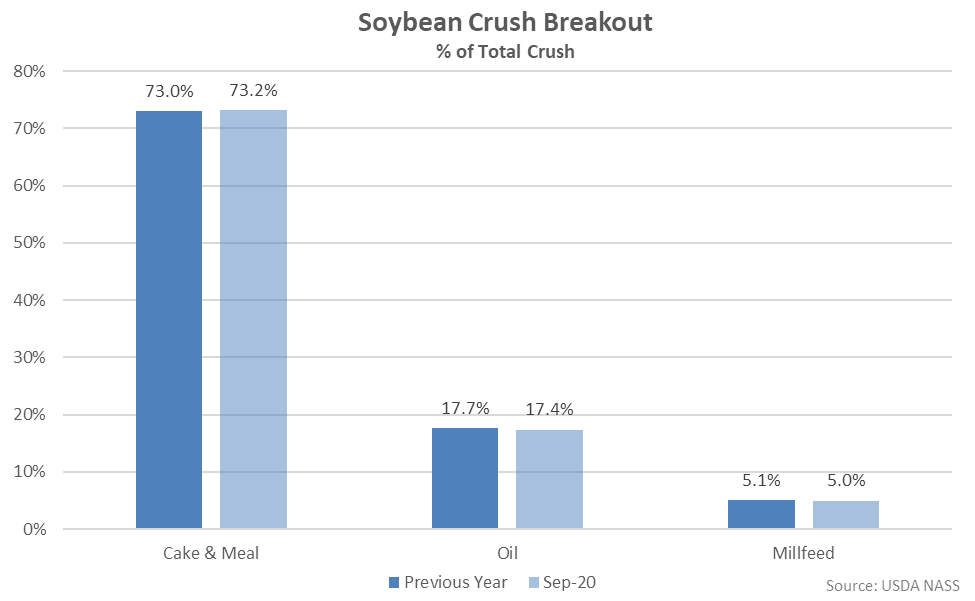
 Cake & meal accounted for 73.2% of the total soybean crush throughout Sep ’20, up slightly from the previous year, while oil accounted for 17.4% of the total soybean crush, down slightly from the previous year.
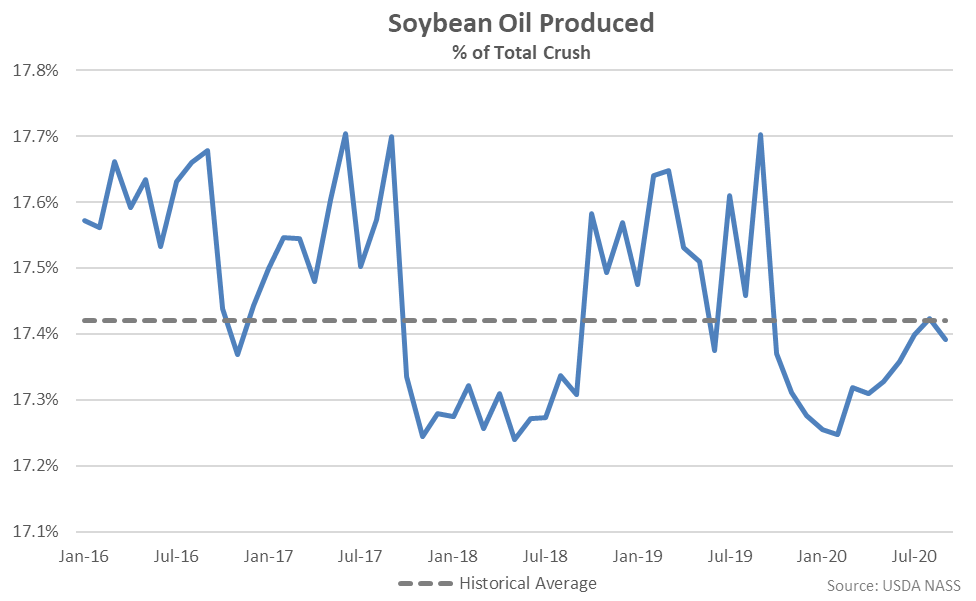
 Sep ’20 soybean oil produced as a percentage of total crush declined from the 11 month high level experienced throughout the previous month, finishing below historical average figures for the 11th time in the past 12 months.
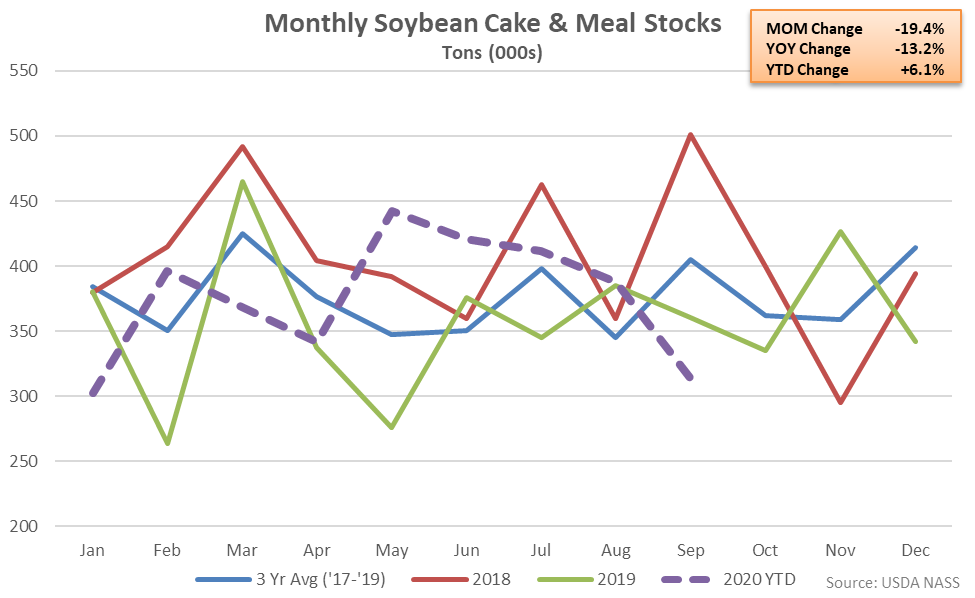
 Soybean Cake & Meal Stocks – Stocks Decline to a Four Year Seasonal Low Level, Down 13.2% YOY
Sep ’20 U.S. soybean cake & meal stocks declined 19.4% from the previous month, finishing 13.2% lower on a YOY basis and reaching a four year seasonal low level. The YOY decline in soybean cake & meal stocks was the first experienced throughout the past six months. The month-over-month decline in soybean cake & meal stocks of 19.4% was a contraseasonal move when compared to the three year average August – September seasonal increase in stocks of 18.2%. Sep ’20 soybean cake & meal stocks finished 22.8% below three year average seasonal levels.
Soybean Cake & Meal Stocks – Stocks Decline to a Four Year Seasonal Low Level, Down 13.2% YOY
Sep ’20 U.S. soybean cake & meal stocks declined 19.4% from the previous month, finishing 13.2% lower on a YOY basis and reaching a four year seasonal low level. The YOY decline in soybean cake & meal stocks was the first experienced throughout the past six months. The month-over-month decline in soybean cake & meal stocks of 19.4% was a contraseasonal move when compared to the three year average August – September seasonal increase in stocks of 18.2%. Sep ’20 soybean cake & meal stocks finished 22.8% below three year average seasonal levels.
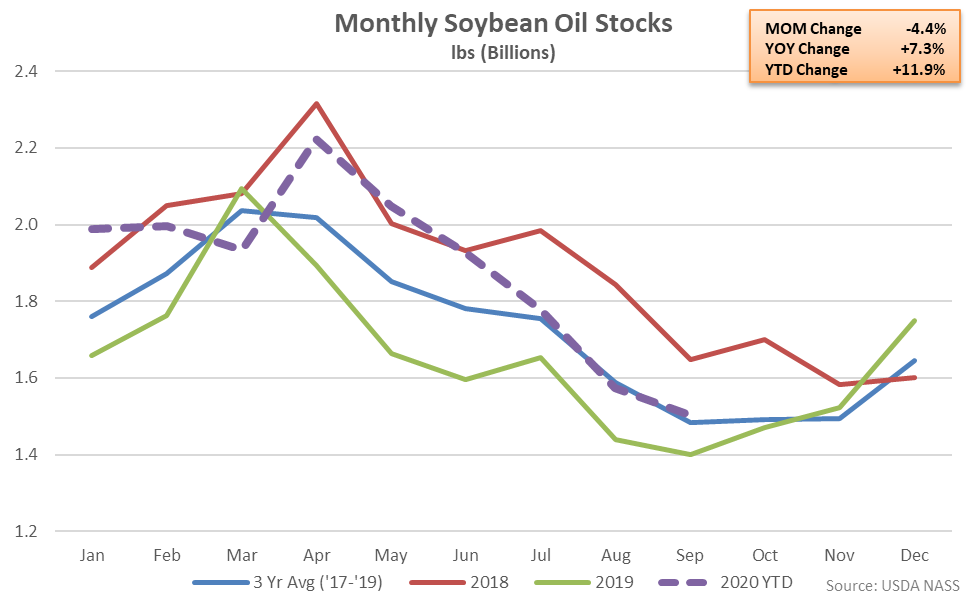
 Soybean Oil Stocks – Stocks Remain Higher YOY for the Ninth Time in Ten Months, up 7.3%
Sep ’20 U.S. soybean oil stocks declined 4.4% from the previous month, reaching an 11 month low level but remaining 7.3% higher on a YOY basis. Soybean oil stocks had finished lower on a YOY basis throughout eight consecutive months through Nov ’19 prior to finishing higher throughout nine of the past ten months. The month-over-month decline in soybean oil stocks of 4.4% was slightly smaller than the three year average August – September seasonal decline of 6.3%. Sep ’20 soybean oil stocks finished 1.4% above three year average seasonal levels, finishing higher for the ninth time in the past ten months.
Soybean Oil Stocks – Stocks Remain Higher YOY for the Ninth Time in Ten Months, up 7.3%
Sep ’20 U.S. soybean oil stocks declined 4.4% from the previous month, reaching an 11 month low level but remaining 7.3% higher on a YOY basis. Soybean oil stocks had finished lower on a YOY basis throughout eight consecutive months through Nov ’19 prior to finishing higher throughout nine of the past ten months. The month-over-month decline in soybean oil stocks of 4.4% was slightly smaller than the three year average August – September seasonal decline of 6.3%. Sep ’20 soybean oil stocks finished 1.4% above three year average seasonal levels, finishing higher for the ninth time in the past ten months.
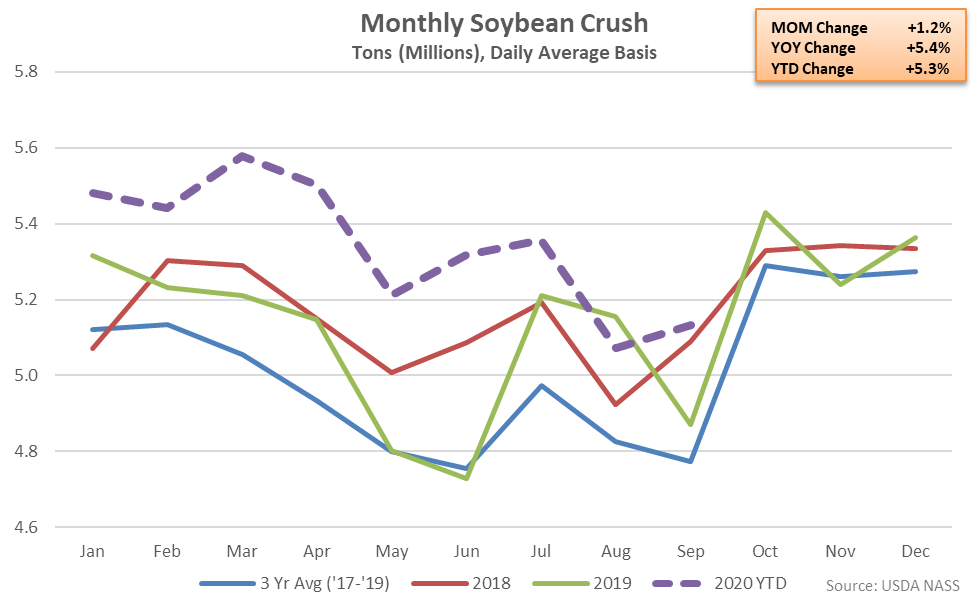
- U.S. soybean crushings increased 5.4% on a YOY basis during Sep ’20, finishing higher for the ninth time in the past ten months.
- U.S. soybean cake & meal stocks declined on a YOY basis for the first time in the past six months during Sep ’20, finishing down 13.2% and reaching a four year seasonal low level.
- U.S. soybean oil stocks remained higher on a YOY basis for the ninth time in the past ten months, finishing up 7.3%.
Cake & meal accounted for 73.2% of the total soybean crush throughout Sep ’20, up slightly from the previous year, while oil accounted for 17.4% of the total soybean crush, down slightly from the previous year.
Sep ’20 soybean oil produced as a percentage of total crush declined from the 11 month high level experienced throughout the previous month, finishing below historical average figures for the 11th time in the past 12 months.
Soybean Cake & Meal Stocks – Stocks Decline to a Four Year Seasonal Low Level, Down 13.2% YOY
Sep ’20 U.S. soybean cake & meal stocks declined 19.4% from the previous month, finishing 13.2% lower on a YOY basis and reaching a four year seasonal low level. The YOY decline in soybean cake & meal stocks was the first experienced throughout the past six months. The month-over-month decline in soybean cake & meal stocks of 19.4% was a contraseasonal move when compared to the three year average August – September seasonal increase in stocks of 18.2%. Sep ’20 soybean cake & meal stocks finished 22.8% below three year average seasonal levels.
Soybean Oil Stocks – Stocks Remain Higher YOY for the Ninth Time in Ten Months, up 7.3%
Sep ’20 U.S. soybean oil stocks declined 4.4% from the previous month, reaching an 11 month low level but remaining 7.3% higher on a YOY basis. Soybean oil stocks had finished lower on a YOY basis throughout eight consecutive months through Nov ’19 prior to finishing higher throughout nine of the past ten months. The month-over-month decline in soybean oil stocks of 4.4% was slightly smaller than the three year average August – September seasonal decline of 6.3%. Sep ’20 soybean oil stocks finished 1.4% above three year average seasonal levels, finishing higher for the ninth time in the past ten months.