Atten Babler Dairy FX Indices – Mar ’20
The Atten Babler Commodities Dairy Foreign Exchange (FX) Indices strengthened throughout Feb ’20. The USD/Dairy Exporter FX Index increased to a record high level while the USD/Dairy Importer FX Index and USD/Domestic Dairy Importer FX Index also finished higher throughout the month.
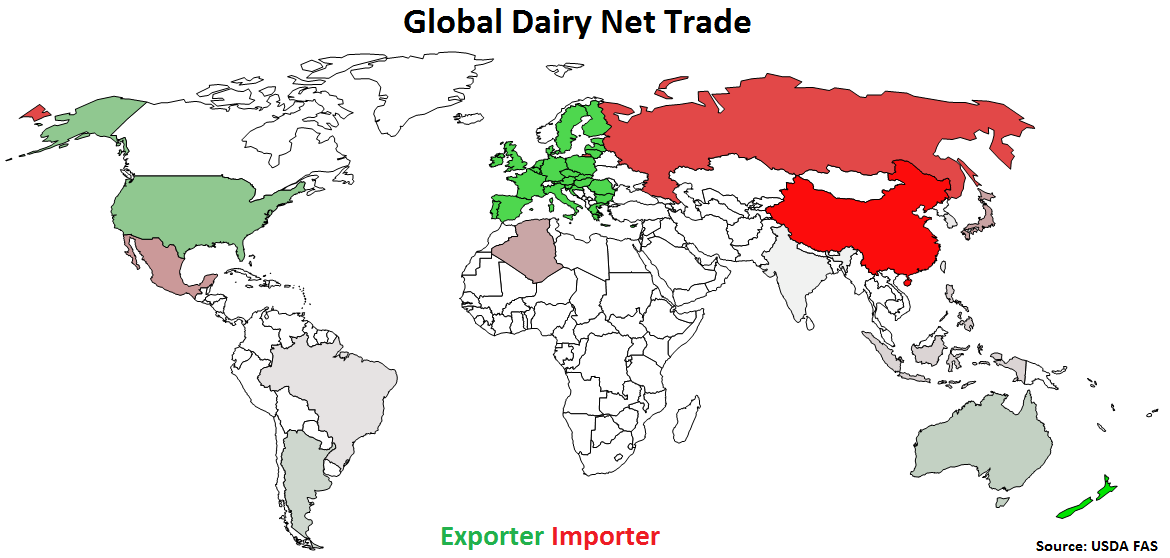
Global Dairy Net Trade:
Major net dairy exporters are led by New Zealand, followed by the EU-28, the U.S., Australia and Argentina (represented in green in the chart below). Major net dairy importers are led by China, followed by Russia, Mexico, Japan, Indonesia, Algeria and the Philippines (represented in red in the chart below).
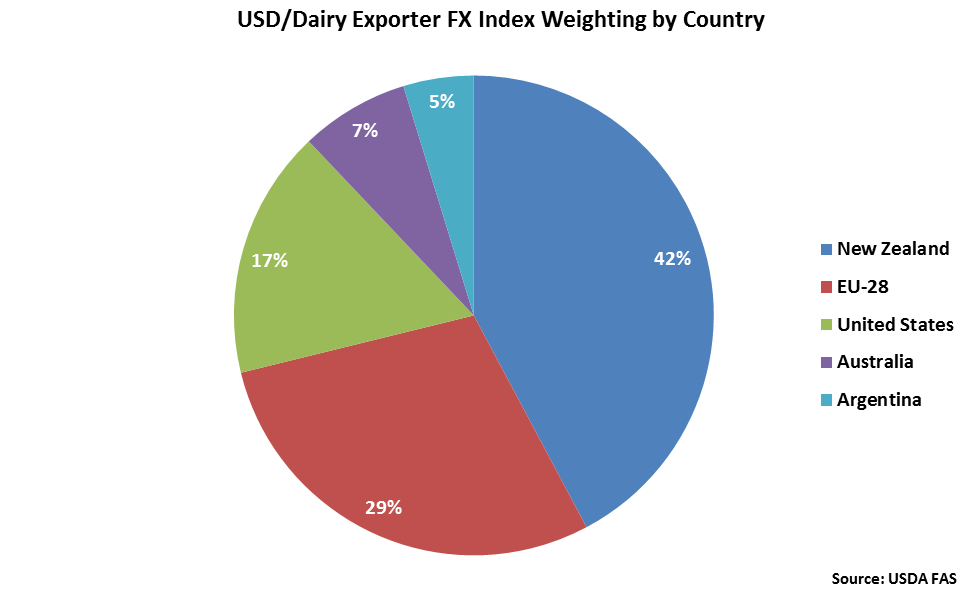
 New Zealand accounts for over two fifths of the USD/Dairy Exporter FX Index, followed by the EU-28 at 29% and the United States at 17%. Australia and Argentina each account for between 5-10% of the index.
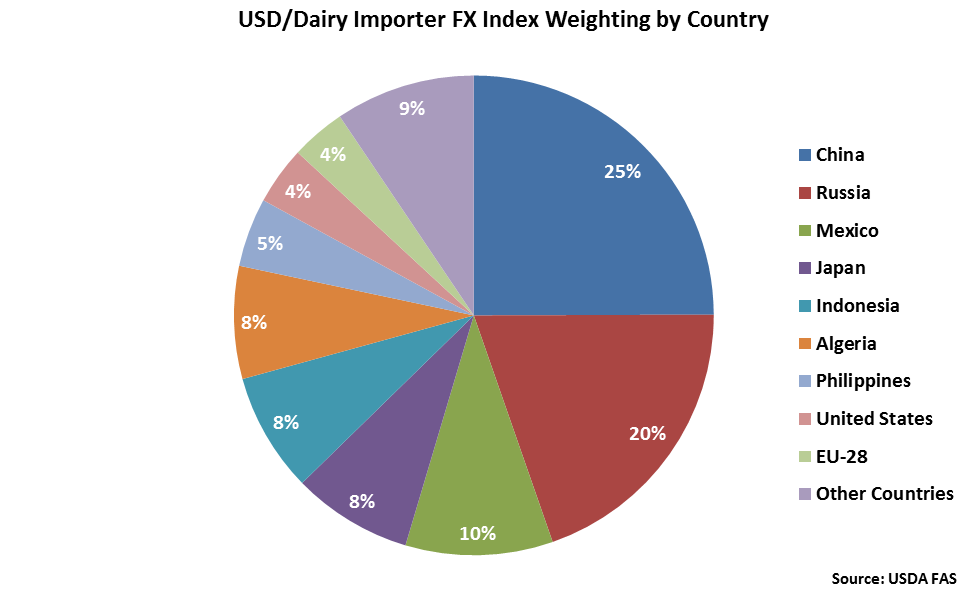
 China accounts for a quarter of the USD/Dairy Importer FX Index while Russia accounts for a fifth. Mexico, Japan, Indonesia, Algeria and the Philippines each account for between 5-10% of the index.
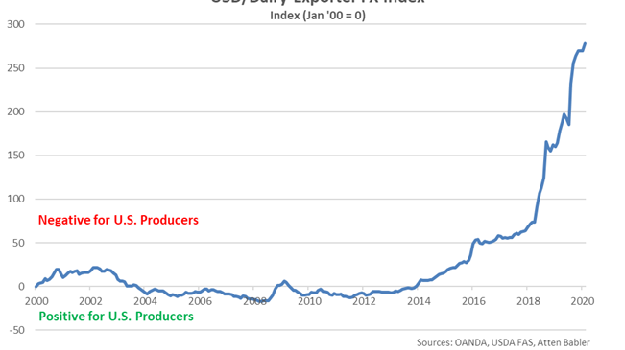
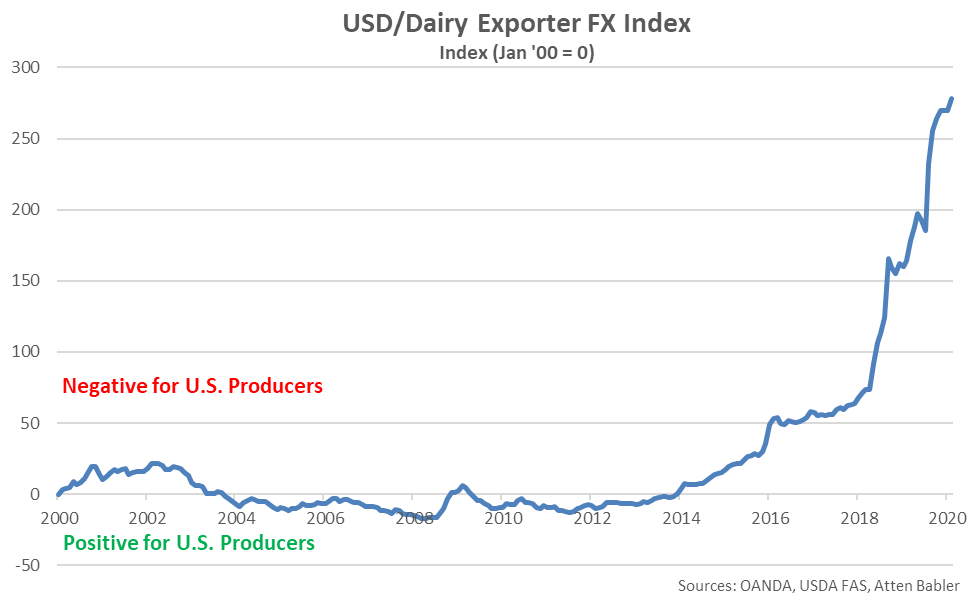
 USD/Dairy Exporter FX Index:
The USD/Dairy Exporter FX Index increased 8.1 points during Feb ’20, finishing at a record high value of 278.0. The USD/Dairy Exporter FX Index has increased 45.8 points throughout the past six months and 277.9 points since the beginning of 2014. A strong USD/Dairy Exporter FX Index reduces the competitiveness of U.S. dairy products relative to other exporting regions (represented in green in the Global Dairy Net Trade chart), ultimately resulting in less foreign demand for U.S. products, all other factors being equal. USD appreciation against the Argentine peso has accounted for the majority of the gains since the beginning of 2014.
USD/Dairy Exporter FX Index:
The USD/Dairy Exporter FX Index increased 8.1 points during Feb ’20, finishing at a record high value of 278.0. The USD/Dairy Exporter FX Index has increased 45.8 points throughout the past six months and 277.9 points since the beginning of 2014. A strong USD/Dairy Exporter FX Index reduces the competitiveness of U.S. dairy products relative to other exporting regions (represented in green in the Global Dairy Net Trade chart), ultimately resulting in less foreign demand for U.S. products, all other factors being equal. USD appreciation against the Argentine peso has accounted for the majority of the gains since the beginning of 2014.
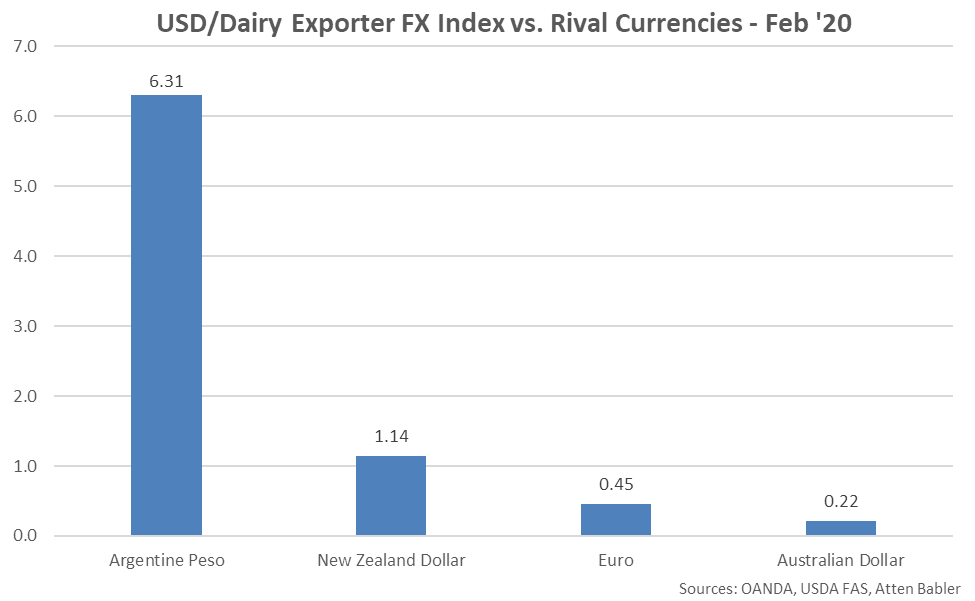
 USD appreciation within the USD/Dairy Exporter FX Index during Feb ’20 was led by gains against the Argentine peso, followed by gains against the New Zealand dollar, euro and Australian dollar.
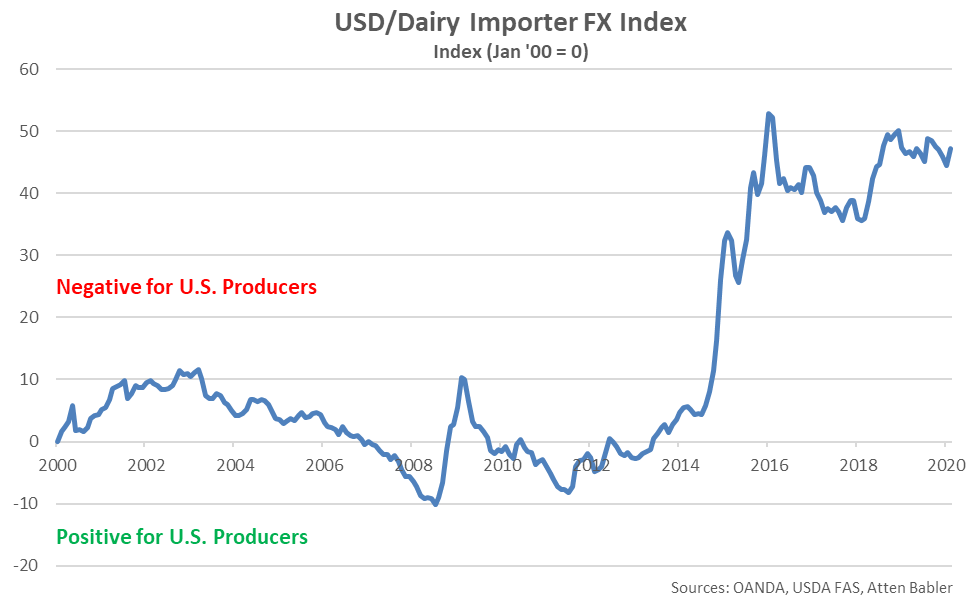
 USD/Dairy Importer FX Index:
The USD/Dairy Importer FX Index increased 2.7 points during Feb ’20, rebounding to a four month high value of 47.1. The USD/Dairy Importer FX Index has declined 1.8 points throughout the past six months but remains up 43.6 points since the beginning of 2014, despite the most recent decline. A strong USD/Dairy Importer FX Index results in less purchasing power for major dairy importing countries (represented in red in the Global Dairy Net Trade chart), making U.S. dairy products more expensive to import. USD appreciation against the Russian ruble has accounted for the majority of the gains since the beginning of 2014.
USD/Dairy Importer FX Index:
The USD/Dairy Importer FX Index increased 2.7 points during Feb ’20, rebounding to a four month high value of 47.1. The USD/Dairy Importer FX Index has declined 1.8 points throughout the past six months but remains up 43.6 points since the beginning of 2014, despite the most recent decline. A strong USD/Dairy Importer FX Index results in less purchasing power for major dairy importing countries (represented in red in the Global Dairy Net Trade chart), making U.S. dairy products more expensive to import. USD appreciation against the Russian ruble has accounted for the majority of the gains since the beginning of 2014.
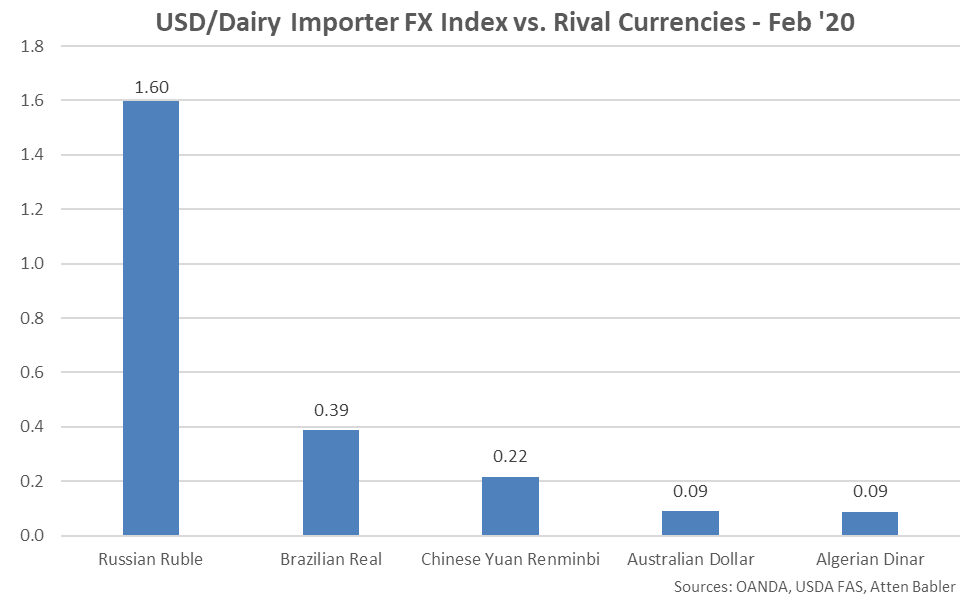
 USD appreciation within the USD/Dairy Importer FX Index during Feb ’20 was led by gains against the Russian ruble, followed by gains against the Brazilian real, Chinese yuan renminbi, Australian dollar and Algerian dinar.
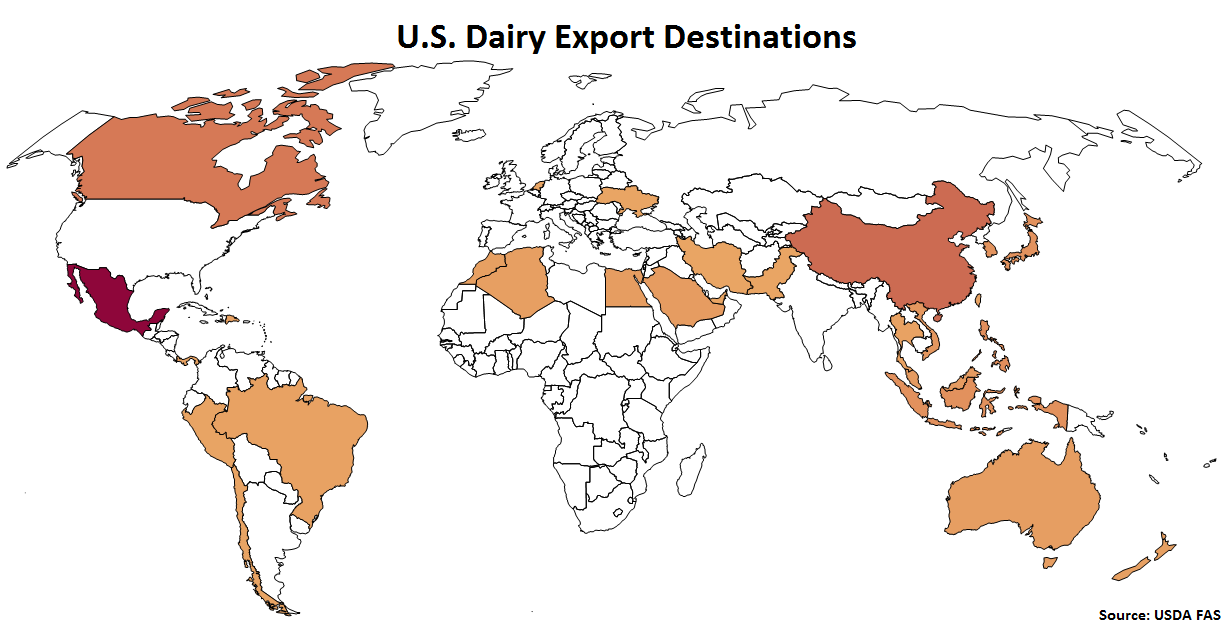
 U.S. Dairy Export Destinations:
Major destinations for U.S. dairy exports are led by Mexico, followed by China, Canada, the Philippines, Indonesia, Japan and South Korea.
U.S. Dairy Export Destinations:
Major destinations for U.S. dairy exports are led by Mexico, followed by China, Canada, the Philippines, Indonesia, Japan and South Korea.
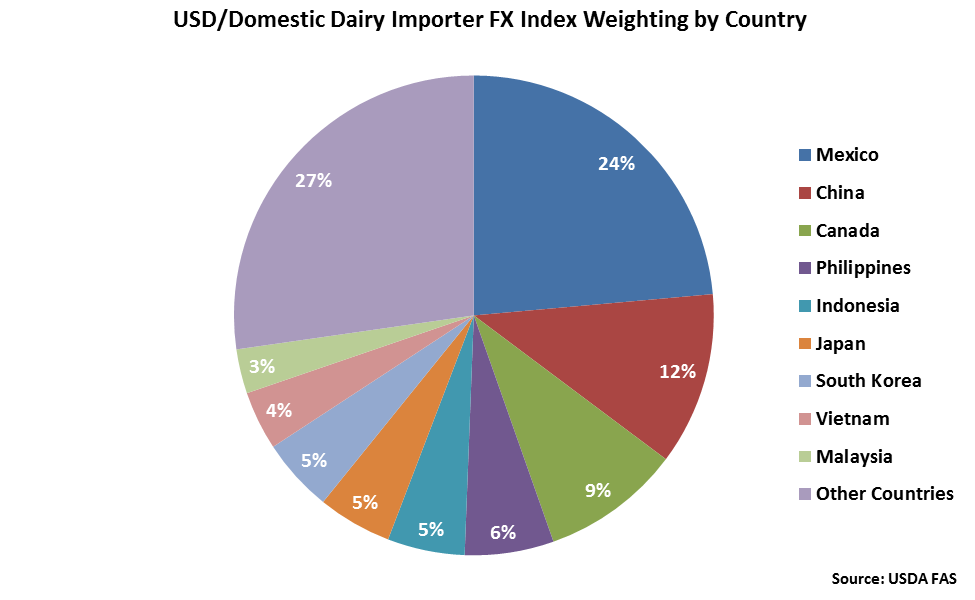
 Mexico accounts for nearly a quarter of the USD/Domestic Dairy Importer FX Index, followed by China at 12%. Canada, the Philippines, Indonesia, Japan and South Korea each account for between 5-10% of the index.
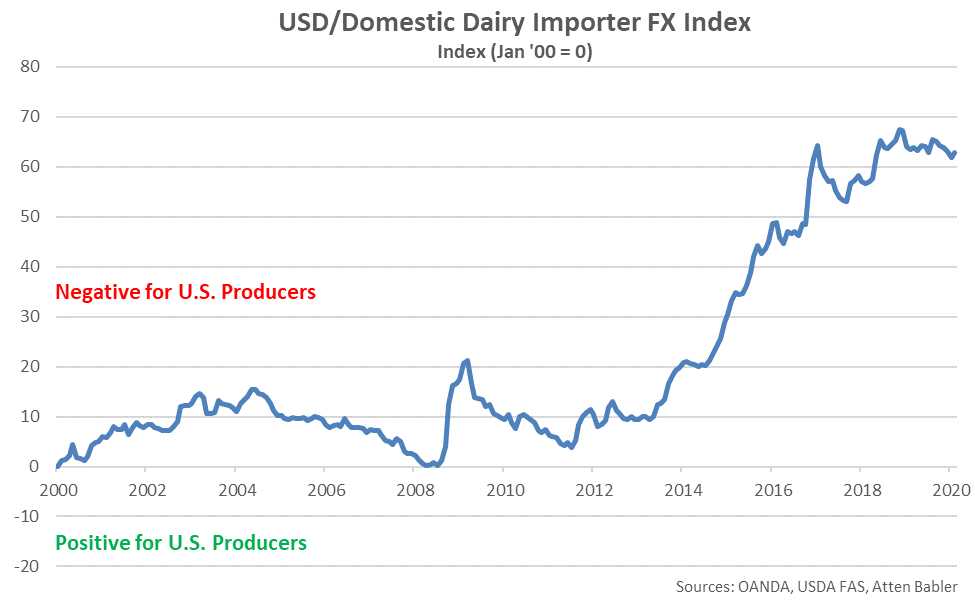
 USD/Domestic Dairy Importer FX Index:
The USD/Domestic Dairy Importer FX Index increased 1.0 point during Feb ’20, finishing at a value of 62.9. The USD/Domestic Dairy Importer FX Index has declined 2.6 point throughout the past six months but remains up 43.1 points since the beginning of 2014. A strong USD/Domestic Dairy Importer FX Index results in less purchasing power for the traditional buyers of U.S. dairy products (represented in red in the U.S. Dairy Export Destinations chart), ultimately resulting in less foreign demand for U.S. products, all other factors being equal. USD appreciation against the Mexican peso and Egyptian pound has accounted for the majority of the gains since the beginning of 2014.
USD/Domestic Dairy Importer FX Index:
The USD/Domestic Dairy Importer FX Index increased 1.0 point during Feb ’20, finishing at a value of 62.9. The USD/Domestic Dairy Importer FX Index has declined 2.6 point throughout the past six months but remains up 43.1 points since the beginning of 2014. A strong USD/Domestic Dairy Importer FX Index results in less purchasing power for the traditional buyers of U.S. dairy products (represented in red in the U.S. Dairy Export Destinations chart), ultimately resulting in less foreign demand for U.S. products, all other factors being equal. USD appreciation against the Mexican peso and Egyptian pound has accounted for the majority of the gains since the beginning of 2014.
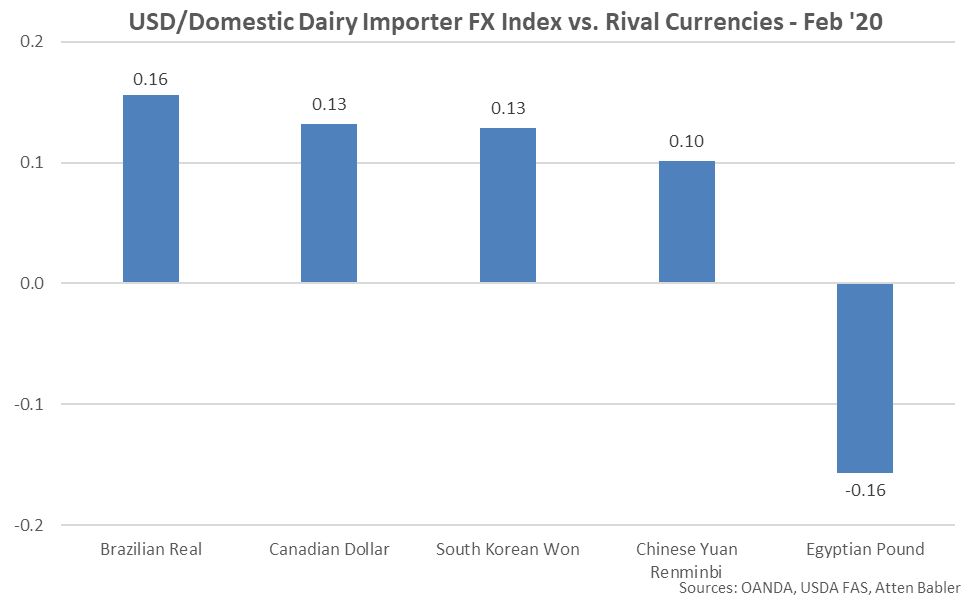
 USD appreciation within the USD/Domestic Dairy Importer FX Index during Feb ’20 was led by gains against the Brazilian real, followed by gains against the Canadian dollar, South Korean won and Chinese yuan renminbi. USD declines were exhibited against the Egyptian pound.
New Zealand accounts for over two fifths of the USD/Dairy Exporter FX Index, followed by the EU-28 at 29% and the United States at 17%. Australia and Argentina each account for between 5-10% of the index.
China accounts for a quarter of the USD/Dairy Importer FX Index while Russia accounts for a fifth. Mexico, Japan, Indonesia, Algeria and the Philippines each account for between 5-10% of the index.
USD/Dairy Exporter FX Index:
The USD/Dairy Exporter FX Index increased 8.1 points during Feb ’20, finishing at a record high value of 278.0. The USD/Dairy Exporter FX Index has increased 45.8 points throughout the past six months and 277.9 points since the beginning of 2014. A strong USD/Dairy Exporter FX Index reduces the competitiveness of U.S. dairy products relative to other exporting regions (represented in green in the Global Dairy Net Trade chart), ultimately resulting in less foreign demand for U.S. products, all other factors being equal. USD appreciation against the Argentine peso has accounted for the majority of the gains since the beginning of 2014.
USD appreciation within the USD/Dairy Exporter FX Index during Feb ’20 was led by gains against the Argentine peso, followed by gains against the New Zealand dollar, euro and Australian dollar.
USD/Dairy Importer FX Index:
The USD/Dairy Importer FX Index increased 2.7 points during Feb ’20, rebounding to a four month high value of 47.1. The USD/Dairy Importer FX Index has declined 1.8 points throughout the past six months but remains up 43.6 points since the beginning of 2014, despite the most recent decline. A strong USD/Dairy Importer FX Index results in less purchasing power for major dairy importing countries (represented in red in the Global Dairy Net Trade chart), making U.S. dairy products more expensive to import. USD appreciation against the Russian ruble has accounted for the majority of the gains since the beginning of 2014.
USD appreciation within the USD/Dairy Importer FX Index during Feb ’20 was led by gains against the Russian ruble, followed by gains against the Brazilian real, Chinese yuan renminbi, Australian dollar and Algerian dinar.
U.S. Dairy Export Destinations:
Major destinations for U.S. dairy exports are led by Mexico, followed by China, Canada, the Philippines, Indonesia, Japan and South Korea.
Mexico accounts for nearly a quarter of the USD/Domestic Dairy Importer FX Index, followed by China at 12%. Canada, the Philippines, Indonesia, Japan and South Korea each account for between 5-10% of the index.
USD/Domestic Dairy Importer FX Index:
The USD/Domestic Dairy Importer FX Index increased 1.0 point during Feb ’20, finishing at a value of 62.9. The USD/Domestic Dairy Importer FX Index has declined 2.6 point throughout the past six months but remains up 43.1 points since the beginning of 2014. A strong USD/Domestic Dairy Importer FX Index results in less purchasing power for the traditional buyers of U.S. dairy products (represented in red in the U.S. Dairy Export Destinations chart), ultimately resulting in less foreign demand for U.S. products, all other factors being equal. USD appreciation against the Mexican peso and Egyptian pound has accounted for the majority of the gains since the beginning of 2014.
USD appreciation within the USD/Domestic Dairy Importer FX Index during Feb ’20 was led by gains against the Brazilian real, followed by gains against the Canadian dollar, South Korean won and Chinese yuan renminbi. USD declines were exhibited against the Egyptian pound.