Soybean Complex Crushing & Stocks Update – Dec ’19
Executive Summary
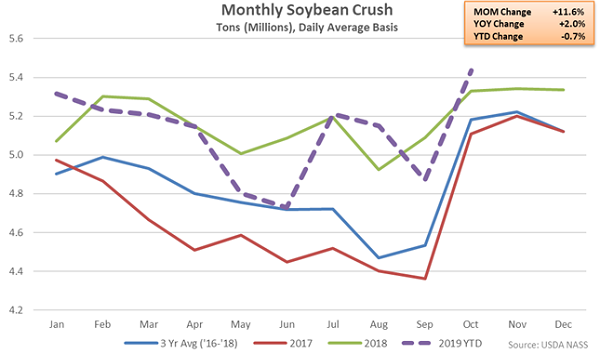
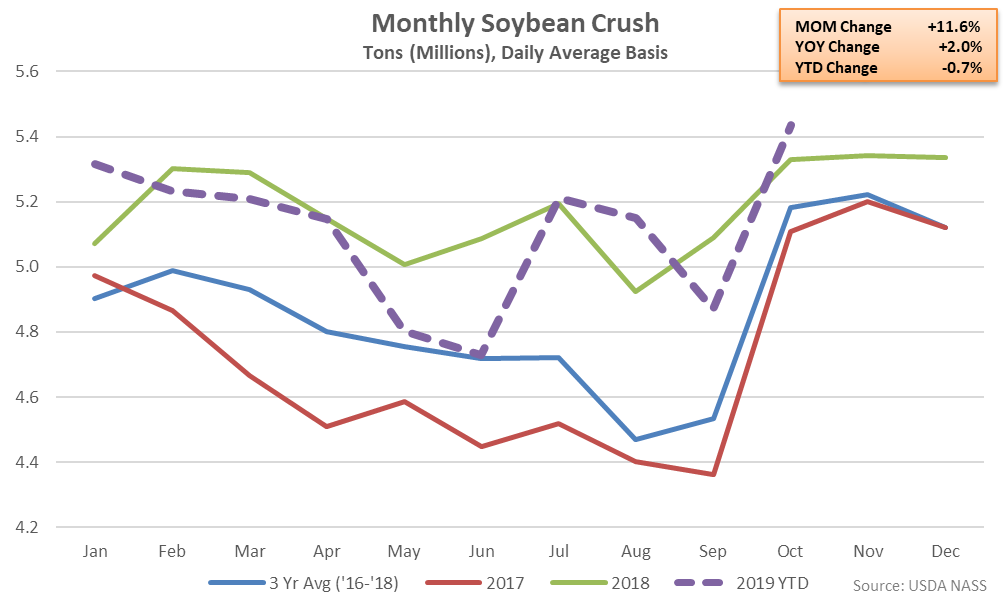
U.S. soybean crush and stocks figures provided by USDA were recently updated with values spanning through Oct ’19. Highlights from the updated report include:
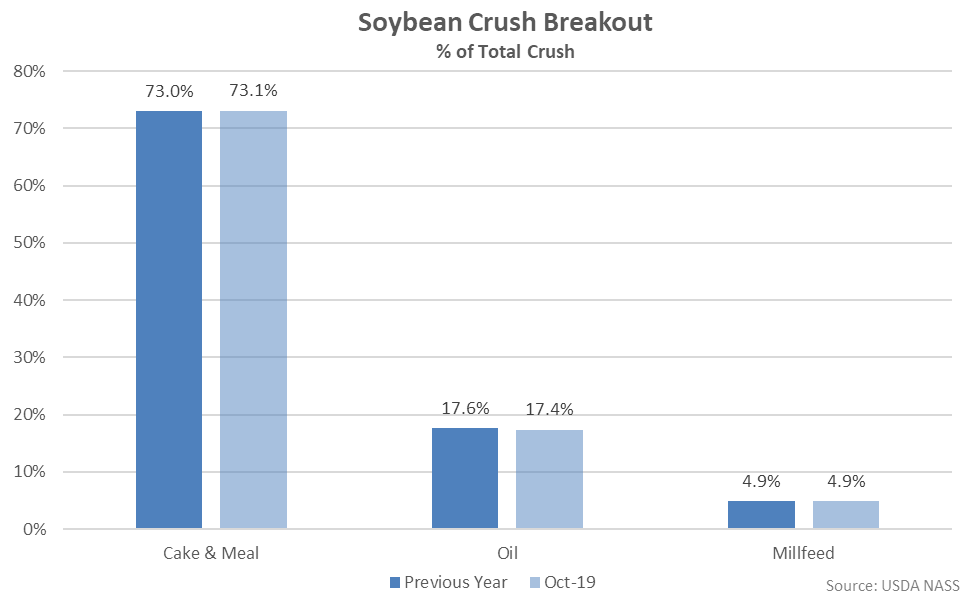
 Cake & Meal accounted for 73.1% of the total soybean crush throughout Oct ’19, up slightly from the previous year, while oil accounted for 17.4% of the total soybean crush, down slightly from the previous year.
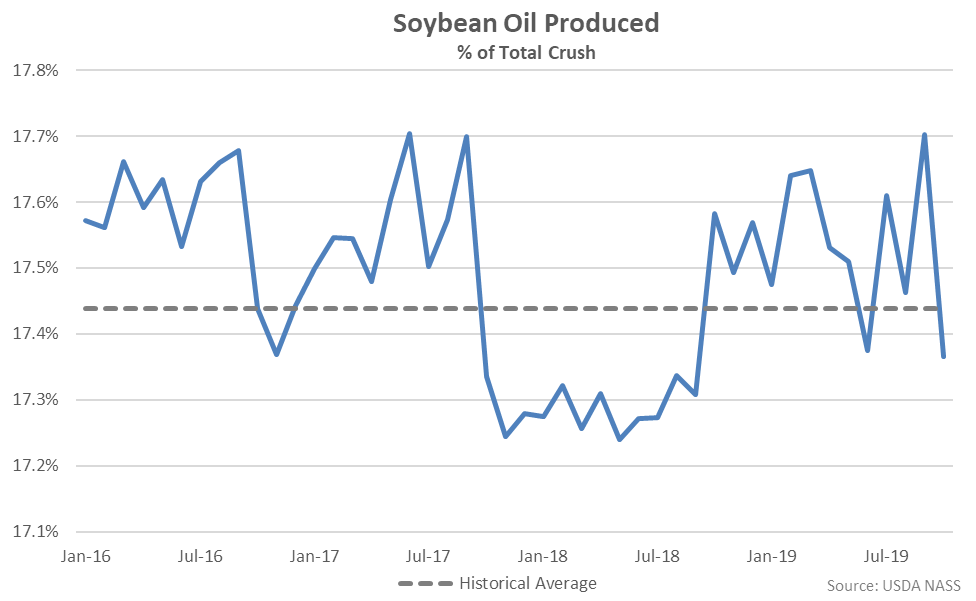
 Oct ’19 soybean oil produced as a percentage of total crush declined from the two year high level experienced throughout the previous month, finishing below historical average figures for just the second time in the past 13 months.
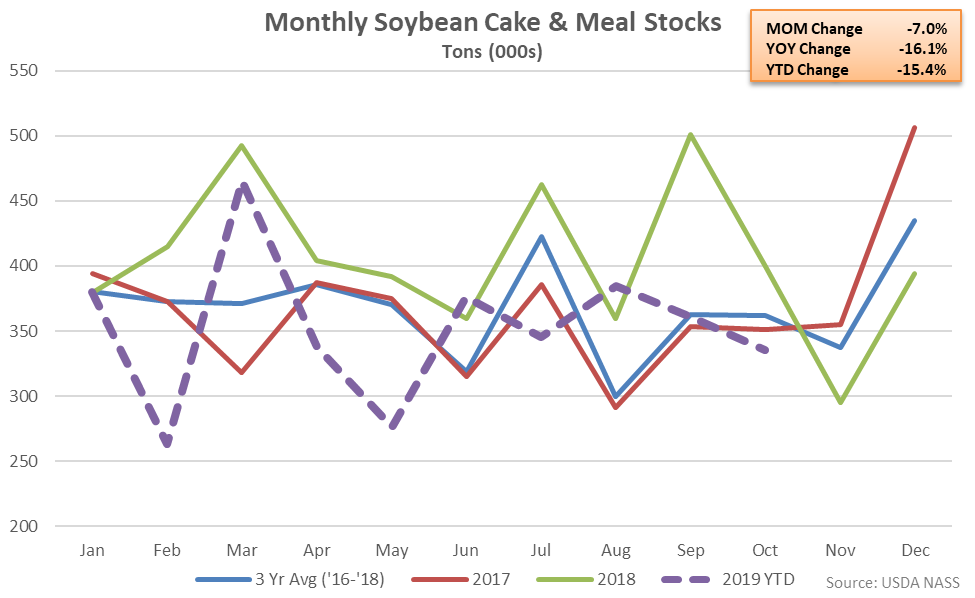
 Soybean Cake & Meal Stocks – Stocks Finish 16.1% Lower YOY, Reach a Five Year Low Seasonal Level
Oct ’19 U.S. soybean cake & meal stocks declined 7.0% MOM and 16.1% YOY, finishing lower on a YOY basis for the seventh time in the past nine months and reaching a five year seasonal low level. The seasonal decline in soybean cake & meal stocks of 7.0% was a contraseasonal move when compared to the three year September – October seasonal average build in stocks of 7.5%. Oct ’19 soybean cake & meal stocks finished 7.4% below three year average seasonal levels.
Soybean Cake & Meal Stocks – Stocks Finish 16.1% Lower YOY, Reach a Five Year Low Seasonal Level
Oct ’19 U.S. soybean cake & meal stocks declined 7.0% MOM and 16.1% YOY, finishing lower on a YOY basis for the seventh time in the past nine months and reaching a five year seasonal low level. The seasonal decline in soybean cake & meal stocks of 7.0% was a contraseasonal move when compared to the three year September – October seasonal average build in stocks of 7.5%. Oct ’19 soybean cake & meal stocks finished 7.4% below three year average seasonal levels.
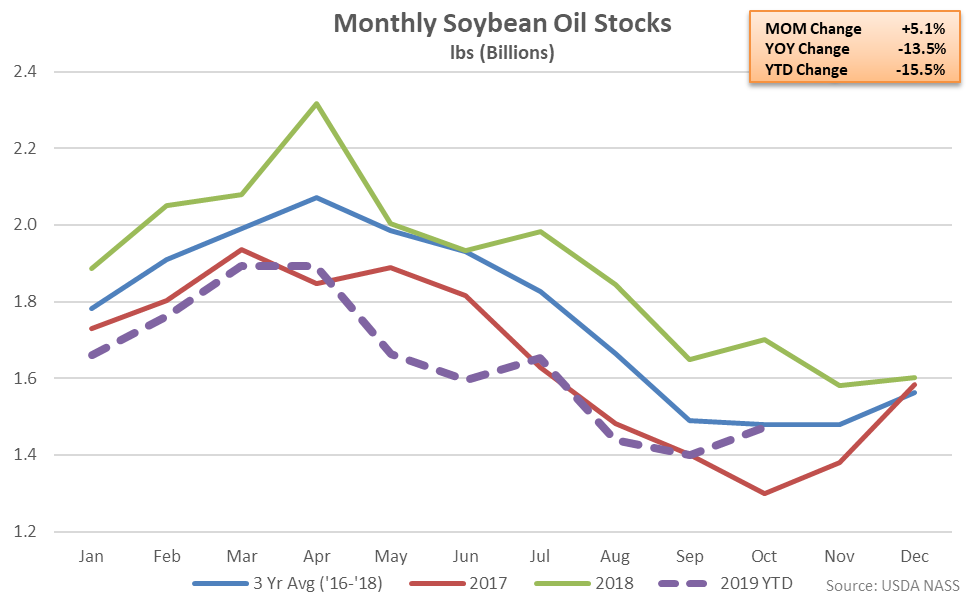
 Soybean Oil Stocks – Stocks Rebound Month-Over-Month but Remain Down 13.5% YOY
Oct ’19 U.S. soybean oil stocks rebounded 5.1% MOM from the 22 month low level experienced throughout the previous month but remained 13.5% below previous year volumes. The YOY decline in soybean oil stocks was the tenth experienced in a row but the smallest experienced throughout the past seven months on a percentage basis. The seasonal build in soybean oil stocks of 5.1% was a contraseasonal move when compared to the three year September – October seasonal average decline of 0.9%. Oct ’19 soybean oil stocks finished 0.5% below three year average seasonal levels.
Soybean Oil Stocks – Stocks Rebound Month-Over-Month but Remain Down 13.5% YOY
Oct ’19 U.S. soybean oil stocks rebounded 5.1% MOM from the 22 month low level experienced throughout the previous month but remained 13.5% below previous year volumes. The YOY decline in soybean oil stocks was the tenth experienced in a row but the smallest experienced throughout the past seven months on a percentage basis. The seasonal build in soybean oil stocks of 5.1% was a contraseasonal move when compared to the three year September – October seasonal average decline of 0.9%. Oct ’19 soybean oil stocks finished 0.5% below three year average seasonal levels.
- Oct ’19 U.S. soybean crushings increased on a YOY basis for the third time in the past four months, finishing up 2.0% and reaching a five year high seasonal level.
- Oct ’19 U.S. soybean cake & meal stocks declined 16.1% YOY, reaching a five year seasonal low level.
- Oct ’19 U.S. soybean oil stocks rebounded from the 22 month low level experienced throughout the previous month but remained 13.5% below previous year volumes.
Cake & Meal accounted for 73.1% of the total soybean crush throughout Oct ’19, up slightly from the previous year, while oil accounted for 17.4% of the total soybean crush, down slightly from the previous year.
Oct ’19 soybean oil produced as a percentage of total crush declined from the two year high level experienced throughout the previous month, finishing below historical average figures for just the second time in the past 13 months.
Soybean Cake & Meal Stocks – Stocks Finish 16.1% Lower YOY, Reach a Five Year Low Seasonal Level
Oct ’19 U.S. soybean cake & meal stocks declined 7.0% MOM and 16.1% YOY, finishing lower on a YOY basis for the seventh time in the past nine months and reaching a five year seasonal low level. The seasonal decline in soybean cake & meal stocks of 7.0% was a contraseasonal move when compared to the three year September – October seasonal average build in stocks of 7.5%. Oct ’19 soybean cake & meal stocks finished 7.4% below three year average seasonal levels.
Soybean Oil Stocks – Stocks Rebound Month-Over-Month but Remain Down 13.5% YOY
Oct ’19 U.S. soybean oil stocks rebounded 5.1% MOM from the 22 month low level experienced throughout the previous month but remained 13.5% below previous year volumes. The YOY decline in soybean oil stocks was the tenth experienced in a row but the smallest experienced throughout the past seven months on a percentage basis. The seasonal build in soybean oil stocks of 5.1% was a contraseasonal move when compared to the three year September – October seasonal average decline of 0.9%. Oct ’19 soybean oil stocks finished 0.5% below three year average seasonal levels.