U.S. Dairy Product Production Update – Mar ’17
Executive Summary
U.S. dairy product production figures provided by USDA were recently updated with values spanning through Jan ’17. Highlights from the updated report include:
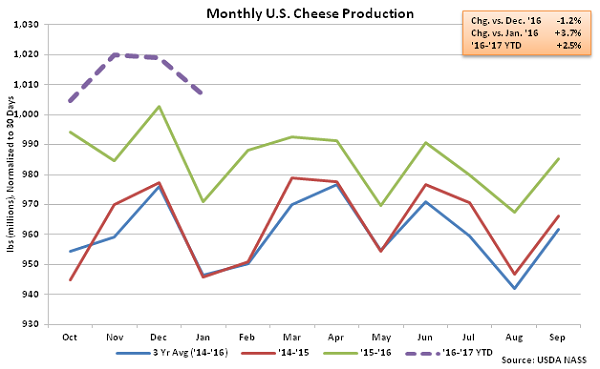
 Cheese – Production Reaches Record High for the Month of January, Finishes up 3.7% YOY
Jan ’17 total U.S. cheese production of 1.04 billion pounds declined 1.2% MOM on a daily average basis but remained higher on a YOY basis for the 46th consecutive month, finishing 3.7% above the previous year and reaching a new record high production level for the month of January. The seasonal decline in cheese production was smaller than the ten year average December – January decline in production of 2.7%. Cheddar cheese production of 306.8 million pounds increased 3.5% YOY while other-than-cheddar cheese production increased 3.7% YOY throughout the month. ’15-’16 annual cheese production increased 2.2% to a new record high, despite cheddar cheese production declining by 0.1% throughout the period. Total cheese production is up an additional 2.5% YOY throughout the first third of the ’16-’17 production season.
Cheese – Production Reaches Record High for the Month of January, Finishes up 3.7% YOY
Jan ’17 total U.S. cheese production of 1.04 billion pounds declined 1.2% MOM on a daily average basis but remained higher on a YOY basis for the 46th consecutive month, finishing 3.7% above the previous year and reaching a new record high production level for the month of January. The seasonal decline in cheese production was smaller than the ten year average December – January decline in production of 2.7%. Cheddar cheese production of 306.8 million pounds increased 3.5% YOY while other-than-cheddar cheese production increased 3.7% YOY throughout the month. ’15-’16 annual cheese production increased 2.2% to a new record high, despite cheddar cheese production declining by 0.1% throughout the period. Total cheese production is up an additional 2.5% YOY throughout the first third of the ’16-’17 production season.
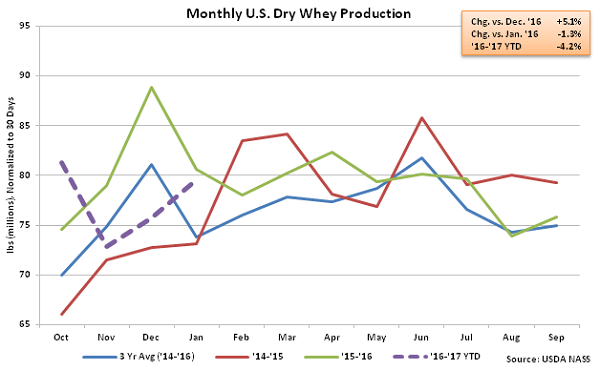
 Dry Whey – Production Remains Lower YOY, Finishes Down 1.3%
Jan ’17 U.S. dry whey production of 82.2 million pounds increased 5.1% MOM on a daily average basis but remained lower on a YOY basis for the third consecutive month, finishing down 1.3%. Combined whey protein concentrate (WPC) and whey protein isolate (WPI) production finished higher on a YOY basis for the first time in four months, however, increasing by 4.4%. Combined WPC and WPI production has declined on a YOY basis over 24 of the past 25 months through December, prior to finishing higher during Jan ’17. Combined dry whey, WPC and WPI production finished higher on a YOY basis for only the second time in the past 12 months during Jan ’17, finishing up 0.8%. ’15-’16 annual dry whey production finished up 3.3% YOY, however combined production of dry whey, WPC and WPI declined 1.2%. Dry whey production has declined 4.2% YOY throughout the first third of the ’16-’17 production season while combined production of dry whey, WPC and WPI is down 3.5%.
Dry Whey – Production Remains Lower YOY, Finishes Down 1.3%
Jan ’17 U.S. dry whey production of 82.2 million pounds increased 5.1% MOM on a daily average basis but remained lower on a YOY basis for the third consecutive month, finishing down 1.3%. Combined whey protein concentrate (WPC) and whey protein isolate (WPI) production finished higher on a YOY basis for the first time in four months, however, increasing by 4.4%. Combined WPC and WPI production has declined on a YOY basis over 24 of the past 25 months through December, prior to finishing higher during Jan ’17. Combined dry whey, WPC and WPI production finished higher on a YOY basis for only the second time in the past 12 months during Jan ’17, finishing up 0.8%. ’15-’16 annual dry whey production finished up 3.3% YOY, however combined production of dry whey, WPC and WPI declined 1.2%. Dry whey production has declined 4.2% YOY throughout the first third of the ’16-’17 production season while combined production of dry whey, WPC and WPI is down 3.5%.
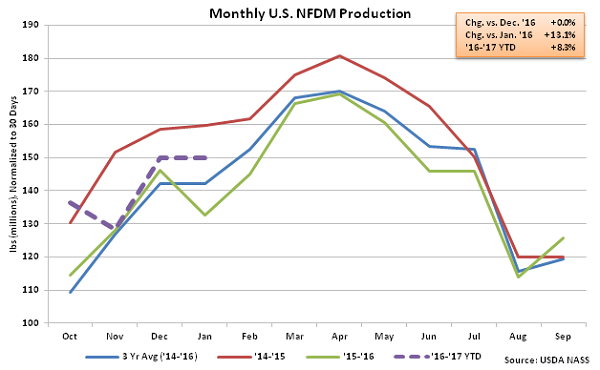
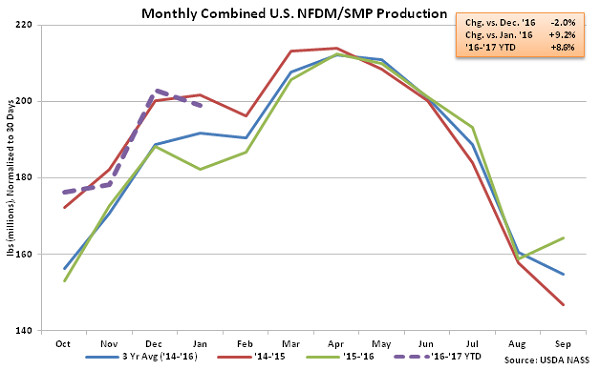
 NFDM/SMP – Higher NFDM Production Offsets Lower SMP Production, Total Production up 9.2% YOY
Jan ’17 U.S. nonfat dry milk (NFDM) production of 155.0 million pounds was flat MOM on a daily average basis but increased 13.1% YOY, finishing higher on a YOY basis for the fifth consecutive month. Skim milk powder (SMP), which is more suited to the requirements of most global markets, declined on a YOY basis for the first time in 15 months, as production of 50.5 million pounds finished 1.4% below the previous year. Increases in NFDM production more than offset declines in SMP production, resulting in Jan ’17 combined production of NFDM and SMP finishing 9.2% higher on a YOY basis. Combined production of NFDM and SMP has increased on a YOY basis over nine consecutive months through January. ’15-’16 annual combined production of NFDM and SMP finished 2.1% lower as a 8.3% decline in NFDM production more than offset a 24.1% increase in SMP production. ’16-’17 YTD combined production of NFDM and SMP has rebounded by 8.6% throughout the first third of the production season.
NFDM/SMP – Higher NFDM Production Offsets Lower SMP Production, Total Production up 9.2% YOY
Jan ’17 U.S. nonfat dry milk (NFDM) production of 155.0 million pounds was flat MOM on a daily average basis but increased 13.1% YOY, finishing higher on a YOY basis for the fifth consecutive month. Skim milk powder (SMP), which is more suited to the requirements of most global markets, declined on a YOY basis for the first time in 15 months, as production of 50.5 million pounds finished 1.4% below the previous year. Increases in NFDM production more than offset declines in SMP production, resulting in Jan ’17 combined production of NFDM and SMP finishing 9.2% higher on a YOY basis. Combined production of NFDM and SMP has increased on a YOY basis over nine consecutive months through January. ’15-’16 annual combined production of NFDM and SMP finished 2.1% lower as a 8.3% decline in NFDM production more than offset a 24.1% increase in SMP production. ’16-’17 YTD combined production of NFDM and SMP has rebounded by 8.6% throughout the first third of the production season.
 Overall, nonfat dry milk production increased most significantly YOY on a percentage basis during Jan ’17, followed by total powder production, while skim milk powder and dry whey production declined on a YOY basis throughout the month.
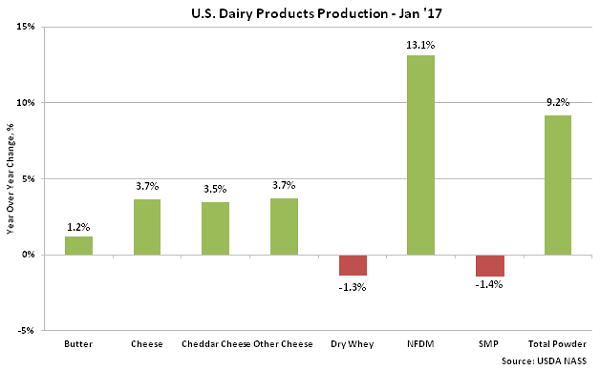
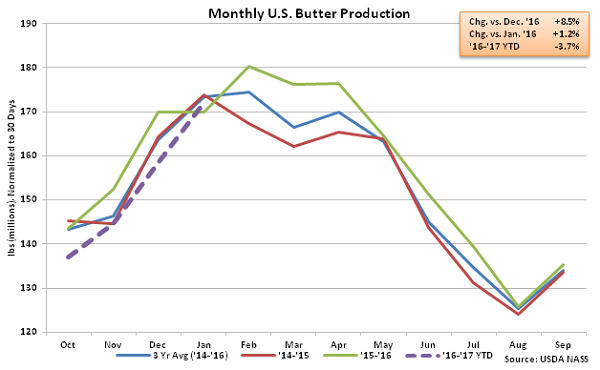
- Jan ’17 U.S. butter production increased on a YOY basis for the first time in four months, finishing 1.2% above the previous year.
- U.S. cheese production remained strong during Jan ’17, increasing 3.7% YOY to a record seasonal high. Cheese production has increased on a YOY basis over 46th consecutive months through January.
- Combined production of U.S. nonfat dry milk and skim milk powder remained higher on a YOY basis for the ninth consecutive month during Jan ’17, increasing by 9.2%, as higher nonfat dry milk production offset lower skim milk powder production.
Cheese – Production Reaches Record High for the Month of January, Finishes up 3.7% YOY
Jan ’17 total U.S. cheese production of 1.04 billion pounds declined 1.2% MOM on a daily average basis but remained higher on a YOY basis for the 46th consecutive month, finishing 3.7% above the previous year and reaching a new record high production level for the month of January. The seasonal decline in cheese production was smaller than the ten year average December – January decline in production of 2.7%. Cheddar cheese production of 306.8 million pounds increased 3.5% YOY while other-than-cheddar cheese production increased 3.7% YOY throughout the month. ’15-’16 annual cheese production increased 2.2% to a new record high, despite cheddar cheese production declining by 0.1% throughout the period. Total cheese production is up an additional 2.5% YOY throughout the first third of the ’16-’17 production season.
Dry Whey – Production Remains Lower YOY, Finishes Down 1.3%
Jan ’17 U.S. dry whey production of 82.2 million pounds increased 5.1% MOM on a daily average basis but remained lower on a YOY basis for the third consecutive month, finishing down 1.3%. Combined whey protein concentrate (WPC) and whey protein isolate (WPI) production finished higher on a YOY basis for the first time in four months, however, increasing by 4.4%. Combined WPC and WPI production has declined on a YOY basis over 24 of the past 25 months through December, prior to finishing higher during Jan ’17. Combined dry whey, WPC and WPI production finished higher on a YOY basis for only the second time in the past 12 months during Jan ’17, finishing up 0.8%. ’15-’16 annual dry whey production finished up 3.3% YOY, however combined production of dry whey, WPC and WPI declined 1.2%. Dry whey production has declined 4.2% YOY throughout the first third of the ’16-’17 production season while combined production of dry whey, WPC and WPI is down 3.5%.
NFDM/SMP – Higher NFDM Production Offsets Lower SMP Production, Total Production up 9.2% YOY
Jan ’17 U.S. nonfat dry milk (NFDM) production of 155.0 million pounds was flat MOM on a daily average basis but increased 13.1% YOY, finishing higher on a YOY basis for the fifth consecutive month. Skim milk powder (SMP), which is more suited to the requirements of most global markets, declined on a YOY basis for the first time in 15 months, as production of 50.5 million pounds finished 1.4% below the previous year. Increases in NFDM production more than offset declines in SMP production, resulting in Jan ’17 combined production of NFDM and SMP finishing 9.2% higher on a YOY basis. Combined production of NFDM and SMP has increased on a YOY basis over nine consecutive months through January. ’15-’16 annual combined production of NFDM and SMP finished 2.1% lower as a 8.3% decline in NFDM production more than offset a 24.1% increase in SMP production. ’16-’17 YTD combined production of NFDM and SMP has rebounded by 8.6% throughout the first third of the production season.
Overall, nonfat dry milk production increased most significantly YOY on a percentage basis during Jan ’17, followed by total powder production, while skim milk powder and dry whey production declined on a YOY basis throughout the month.