Atten Babler Meat FX Indices – Mar ’17
The Atten Babler Commodities Meat Foreign Exchange (FX) Indices finished lower throughout Feb ’17. The USD/Domestic Meat Importer FX Index declined the most throughout the month, followed by the USD/ Meat Exporter FX Index and the USD/Meat Importer FX Index.
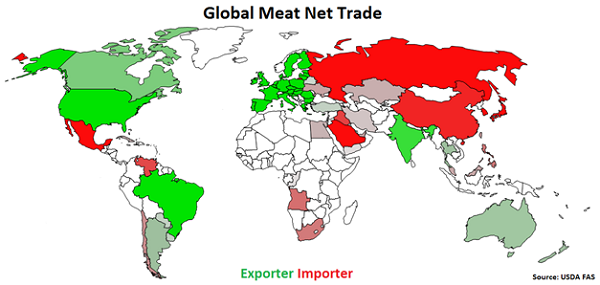
Global Meat Net Trade:
Major net meat exporters are led by the U.S., followed by Brazil, the EU-28, India, Canada and Australia (represented in green in the chart below). Major net meat importers are led by Japan, followed by Russia, Mexico, the U.S., China, the EU-28, Hong Kong and Saudi Arabia (represented in red in the chart below).
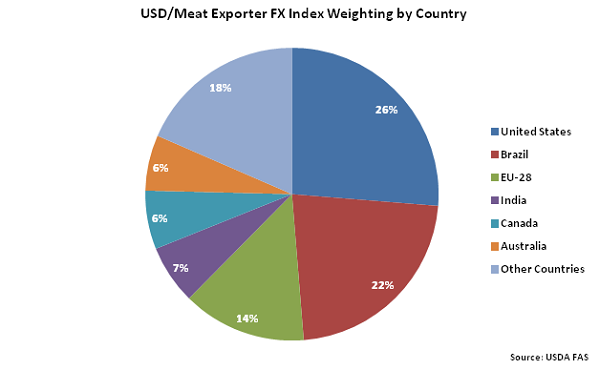
 The United States accounts for over a quarter of the USD/Meat Exporter FX Index, followed by Brazil at 22% and the EU-28 at 14%. India, Canada and Australia each account for between 5-10% of the index.
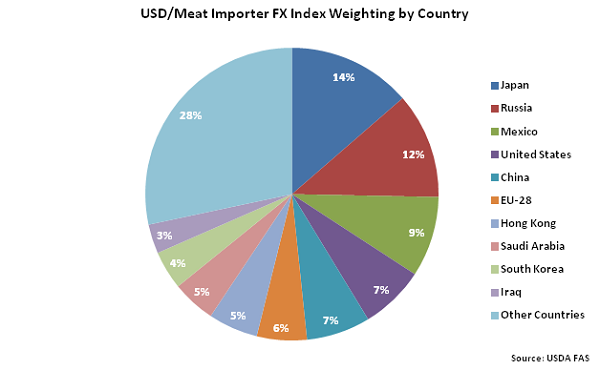
 Japan accounts for 14% of the USD/Meat Importer FX Index, followed by Russia at 12%. Mexico, the United States, China, the EU-28, Hong Kong and Saudi Arabia each account for between 5-10% of the index.
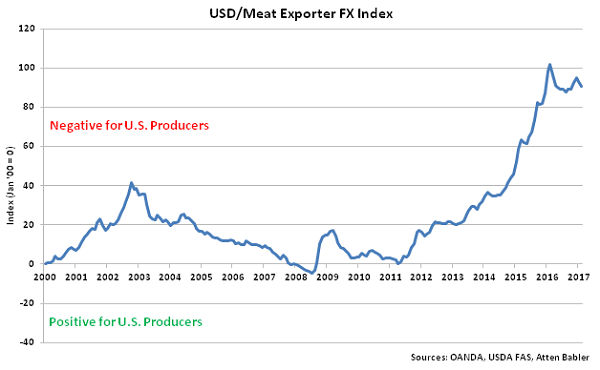
 USD/Meat Exporter FX Index:
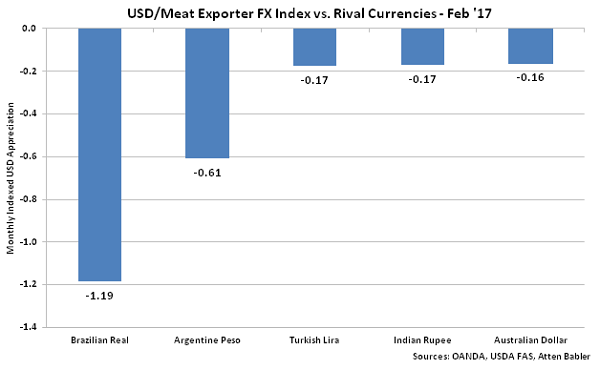
The USD/Meat Exporter FX Index declined 2.6 points during Feb ’17, finishing at a four month low value of 90.7. Despite recent declines, the USD/Meat Exporter FX Index remains up 2.8 points throughout the past six months and 58.8 points since the beginning of 2014. A strong USD/Meat Exporter FX Index reduces the competitiveness of U.S. meat relative to other exporting regions (represented in green in the Global Meat Net Trade chart), ultimately resulting in less foreign demand, all other factors being equal. USD appreciation against the Belarusian ruble and Argentine peso has accounted for the majority of the gains since the beginning of 2014.
USD/Meat Exporter FX Index:
The USD/Meat Exporter FX Index declined 2.6 points during Feb ’17, finishing at a four month low value of 90.7. Despite recent declines, the USD/Meat Exporter FX Index remains up 2.8 points throughout the past six months and 58.8 points since the beginning of 2014. A strong USD/Meat Exporter FX Index reduces the competitiveness of U.S. meat relative to other exporting regions (represented in green in the Global Meat Net Trade chart), ultimately resulting in less foreign demand, all other factors being equal. USD appreciation against the Belarusian ruble and Argentine peso has accounted for the majority of the gains since the beginning of 2014.
 Appreciation against the USD within the USD/Meat Exporter FX Index during Feb ’17 was led by gains by the Brazilian real, followed by gains by the Argentine peso, Turkish lira, Indian rupee and Australian dollar.
 USD/Meat Importer FX Index:
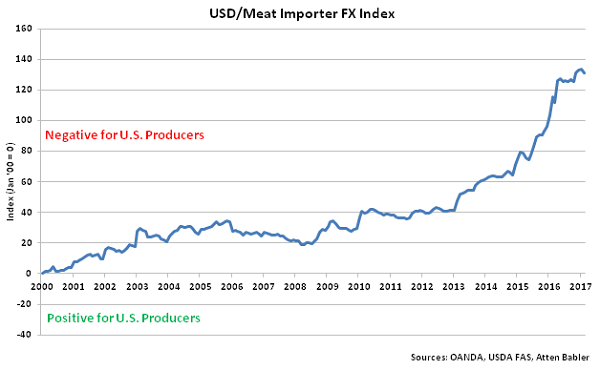
The USD/Meat Importer FX Index declined 2.5 points from the previous month’s record high during Feb ’17, finishing at a three month low value of 131.0. Despite the decline, the USD/Meat Importer FX Index remains up 5.5 points throughout the past six months and 69.8 points since the beginning of 2014. A strong USD/Meat Importer FX Index results in less purchasing power for major meat importing countries (represented in red in the Global Meat Net Trade chart), making U.S. meat more expensive to import. USD appreciation against the Venezuelan bolivar, Angolan kwanza and Russian ruble has accounted for the majority of the gains since the beginning of 2014.
USD/Meat Importer FX Index:
The USD/Meat Importer FX Index declined 2.5 points from the previous month’s record high during Feb ’17, finishing at a three month low value of 131.0. Despite the decline, the USD/Meat Importer FX Index remains up 5.5 points throughout the past six months and 69.8 points since the beginning of 2014. A strong USD/Meat Importer FX Index results in less purchasing power for major meat importing countries (represented in red in the Global Meat Net Trade chart), making U.S. meat more expensive to import. USD appreciation against the Venezuelan bolivar, Angolan kwanza and Russian ruble has accounted for the majority of the gains since the beginning of 2014.
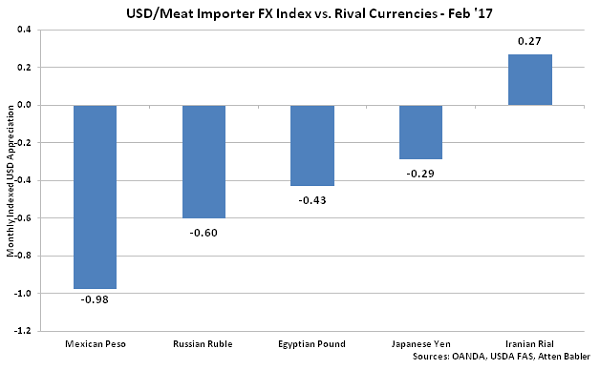
 Appreciation against the USD within the USD/Meat Importer FX Index during Feb ’17 was led by gains by the Mexican peso, followed by gains by the Russian ruble, Egyptian pound and Japanese yen. USD gains were exhibited against the Iranian rial.
 U.S. Meat Export Destinations:
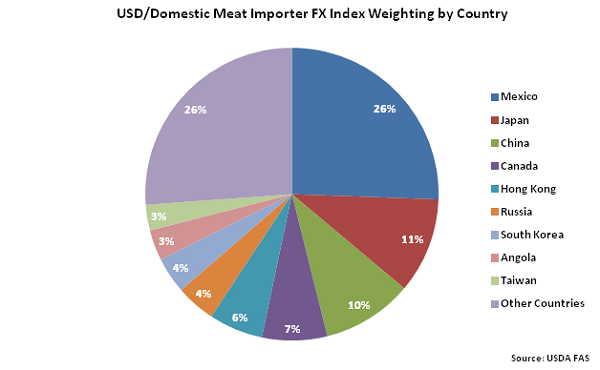
Major destinations for U.S. meat exports are led by Mexico, followed by Japan, China, Canada, and Hong Kong.
U.S. Meat Export Destinations:
Major destinations for U.S. meat exports are led by Mexico, followed by Japan, China, Canada, and Hong Kong.
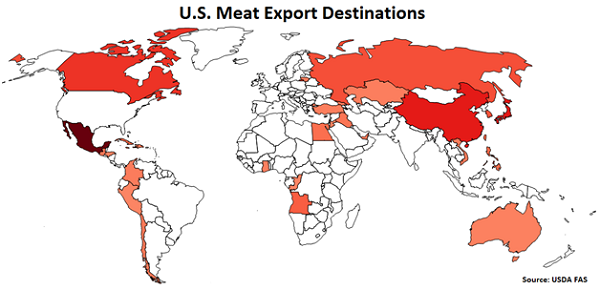 Mexico accounts for over a quarter of the USD/Domestic Meat Importer FX Index, followed by Japan at 11%. China, Canada and Hong Kong each account for between 5-10% of the index.
 USD/Domestic Meat Importer FX Index:
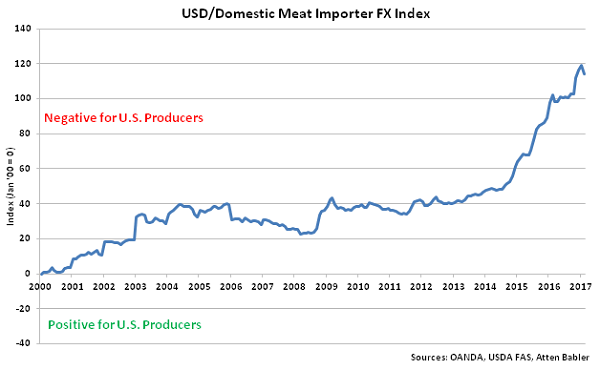
The USD/Domestic Meat Importer FX Index declined 4.6 points from the previous month’s record high during Feb ’17, finishing at a three month low value of 114.4. Despite the decline, the USD/Domestic Meat Importer FX Index remains up 13.6 points throughout the past six months and 68.0 points since the beginning of 2014. A strong USD/Domestic Meat Importer FX Index results in less purchasing power for the traditional buyers of U.S. meat (represented in red in the U.S. Meat Export Destinations chart), ultimately resulting in less foreign demand, all other factors being equal. USD appreciation against the Angolan kwanza and Mexican peso has accounted for the majority of the gains since the beginning of 2014.
USD/Domestic Meat Importer FX Index:
The USD/Domestic Meat Importer FX Index declined 4.6 points from the previous month’s record high during Feb ’17, finishing at a three month low value of 114.4. Despite the decline, the USD/Domestic Meat Importer FX Index remains up 13.6 points throughout the past six months and 68.0 points since the beginning of 2014. A strong USD/Domestic Meat Importer FX Index results in less purchasing power for the traditional buyers of U.S. meat (represented in red in the U.S. Meat Export Destinations chart), ultimately resulting in less foreign demand, all other factors being equal. USD appreciation against the Angolan kwanza and Mexican peso has accounted for the majority of the gains since the beginning of 2014.
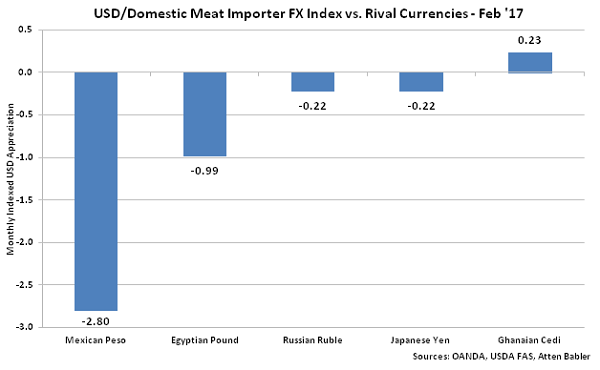
 Appreciation against the USD within the USD/Domestic Meat Importer FX Index during Feb ’17 was led by gains by the Mexican peso, followed by gains by the Egyptian pound, Russian ruble and Japanese yen. USD gains were exhibited against the Ghanaian cedi.
The United States accounts for over a quarter of the USD/Meat Exporter FX Index, followed by Brazil at 22% and the EU-28 at 14%. India, Canada and Australia each account for between 5-10% of the index.
Japan accounts for 14% of the USD/Meat Importer FX Index, followed by Russia at 12%. Mexico, the United States, China, the EU-28, Hong Kong and Saudi Arabia each account for between 5-10% of the index.
USD/Meat Exporter FX Index:
The USD/Meat Exporter FX Index declined 2.6 points during Feb ’17, finishing at a four month low value of 90.7. Despite recent declines, the USD/Meat Exporter FX Index remains up 2.8 points throughout the past six months and 58.8 points since the beginning of 2014. A strong USD/Meat Exporter FX Index reduces the competitiveness of U.S. meat relative to other exporting regions (represented in green in the Global Meat Net Trade chart), ultimately resulting in less foreign demand, all other factors being equal. USD appreciation against the Belarusian ruble and Argentine peso has accounted for the majority of the gains since the beginning of 2014.
Appreciation against the USD within the USD/Meat Exporter FX Index during Feb ’17 was led by gains by the Brazilian real, followed by gains by the Argentine peso, Turkish lira, Indian rupee and Australian dollar.
USD/Meat Importer FX Index:
The USD/Meat Importer FX Index declined 2.5 points from the previous month’s record high during Feb ’17, finishing at a three month low value of 131.0. Despite the decline, the USD/Meat Importer FX Index remains up 5.5 points throughout the past six months and 69.8 points since the beginning of 2014. A strong USD/Meat Importer FX Index results in less purchasing power for major meat importing countries (represented in red in the Global Meat Net Trade chart), making U.S. meat more expensive to import. USD appreciation against the Venezuelan bolivar, Angolan kwanza and Russian ruble has accounted for the majority of the gains since the beginning of 2014.
Appreciation against the USD within the USD/Meat Importer FX Index during Feb ’17 was led by gains by the Mexican peso, followed by gains by the Russian ruble, Egyptian pound and Japanese yen. USD gains were exhibited against the Iranian rial.
U.S. Meat Export Destinations:
Major destinations for U.S. meat exports are led by Mexico, followed by Japan, China, Canada, and Hong Kong.
Mexico accounts for over a quarter of the USD/Domestic Meat Importer FX Index, followed by Japan at 11%. China, Canada and Hong Kong each account for between 5-10% of the index.
USD/Domestic Meat Importer FX Index:
The USD/Domestic Meat Importer FX Index declined 4.6 points from the previous month’s record high during Feb ’17, finishing at a three month low value of 114.4. Despite the decline, the USD/Domestic Meat Importer FX Index remains up 13.6 points throughout the past six months and 68.0 points since the beginning of 2014. A strong USD/Domestic Meat Importer FX Index results in less purchasing power for the traditional buyers of U.S. meat (represented in red in the U.S. Meat Export Destinations chart), ultimately resulting in less foreign demand, all other factors being equal. USD appreciation against the Angolan kwanza and Mexican peso has accounted for the majority of the gains since the beginning of 2014.
Appreciation against the USD within the USD/Domestic Meat Importer FX Index during Feb ’17 was led by gains by the Mexican peso, followed by gains by the Egyptian pound, Russian ruble and Japanese yen. USD gains were exhibited against the Ghanaian cedi.