Ethanol Rail Movements Update – Feb ’17
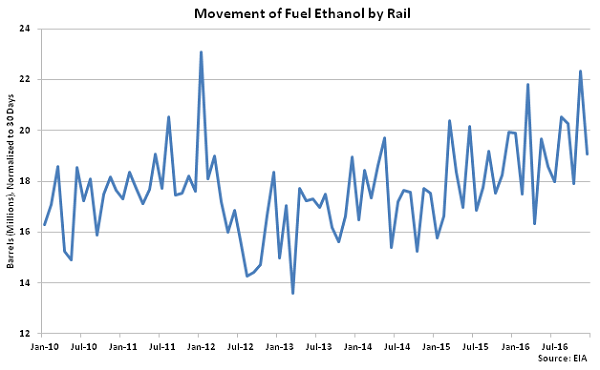
Dec ’16 ethanol rail movements of 19.7 million barrels declined 14.5% on a daily average basis from the four and a half year high experienced during the previous month but remained 8.1% above historical average figures reported since the beginning of 2010.
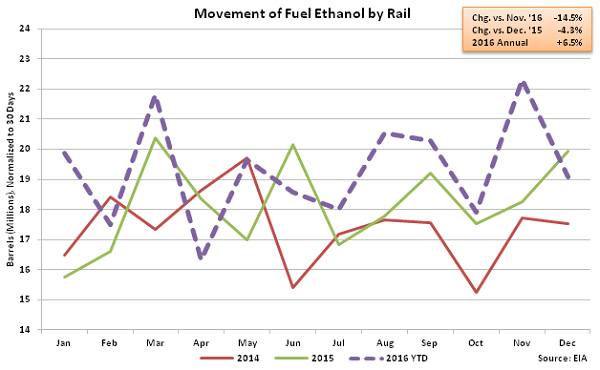
 Despite ethanol rail movements finishing 4.3% lower on a year-over-year (YOY) basis throughout Dec ’16, 2016 annual rail movements increased 6.5% YOY, finishing at a record annual high.
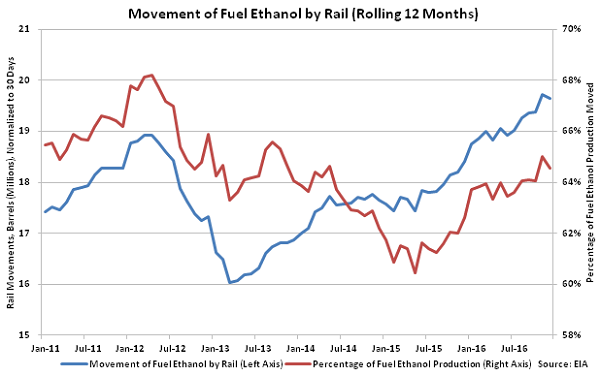
 12 month average ethanol rail movements have ranged from 60% – 68% of monthly ethanol production, historically. Dec ’16 ethanol rail movements accounted for 64.6% of monthly production on a 12 month rolling average basis, which was slightly above the historical average of 64.3%.
 Ethanol rail movement figures are broken out by Petroleum Administration for Defense District (PADD) for both originating rail movements and destinations of shipments. The U.S. is regionally divided into five PADDs, which include the East Coast, Midwest, Gulf Coast, Rocky Mountain and West Coast.
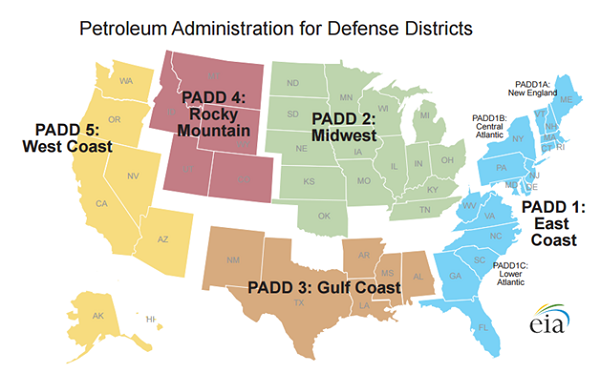 Over 96% of rail movements originated in PADD 2 (Midwest) during Dec ’16, with the remaining volumes originating in PADD 3 (Gulf Coast). Nearly 8.4 million barrels of ethanol rail movements were destined to PADD 1 (East Coast) during Dec ’16, leading all regional districts.
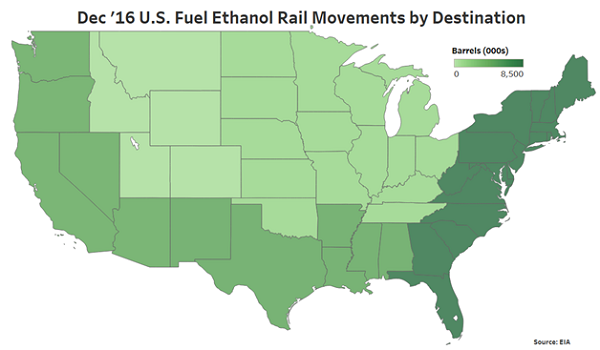 Ethanol rail movements destined to PADD 1 (East Coast) accounted for over two fifths of the total shipments during Dec ’16. Combined shipments to PADD 1 (East Coast), PADD 3 (Gulf Coast) and PADD 5 (West Coast) consisted of nearly 90% of total ethanol rail movements, with minimal amounts being shipped to PADD 2 (Midwest), PADD 4 (Rocky Mountain) and Canada.
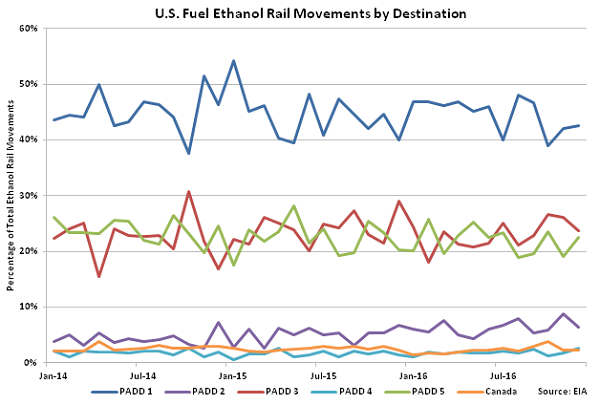
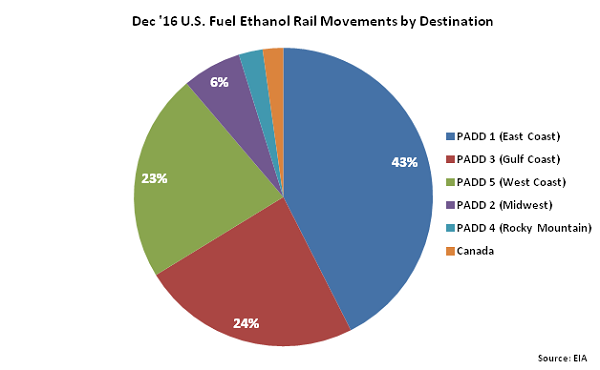 Ethanol rail movements destined to PADD 1 (East Coast) have accounted for between 37% – 55% of the total monthly shipments, historically, but finished most significantly below historical average levels during Dec ’16.
Despite ethanol rail movements finishing 4.3% lower on a year-over-year (YOY) basis throughout Dec ’16, 2016 annual rail movements increased 6.5% YOY, finishing at a record annual high.
12 month average ethanol rail movements have ranged from 60% – 68% of monthly ethanol production, historically. Dec ’16 ethanol rail movements accounted for 64.6% of monthly production on a 12 month rolling average basis, which was slightly above the historical average of 64.3%.
Ethanol rail movement figures are broken out by Petroleum Administration for Defense District (PADD) for both originating rail movements and destinations of shipments. The U.S. is regionally divided into five PADDs, which include the East Coast, Midwest, Gulf Coast, Rocky Mountain and West Coast.
Over 96% of rail movements originated in PADD 2 (Midwest) during Dec ’16, with the remaining volumes originating in PADD 3 (Gulf Coast). Nearly 8.4 million barrels of ethanol rail movements were destined to PADD 1 (East Coast) during Dec ’16, leading all regional districts.
Ethanol rail movements destined to PADD 1 (East Coast) accounted for over two fifths of the total shipments during Dec ’16. Combined shipments to PADD 1 (East Coast), PADD 3 (Gulf Coast) and PADD 5 (West Coast) consisted of nearly 90% of total ethanol rail movements, with minimal amounts being shipped to PADD 2 (Midwest), PADD 4 (Rocky Mountain) and Canada.
Ethanol rail movements destined to PADD 1 (East Coast) have accounted for between 37% – 55% of the total monthly shipments, historically, but finished most significantly below historical average levels during Dec ’16.