U.S. Dairy Product Production Update – Jan ’17
Executive Summary
U.S. dairy product production figures provided by USDA were recently updated with values spanning through Nov ’16. Highlights from the updated report include:
 Cheese – Production Reaches Record High for the Month of November, Finishes up 2.7% YOY
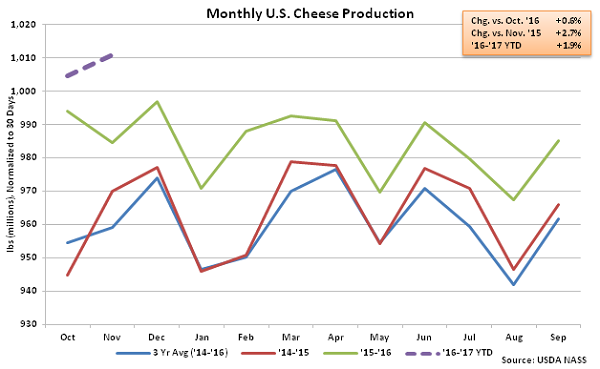
Nov ’16 total U.S. cheese production of 1.01 billion pounds increased on a YOY basis for the 44th consecutive month, finishing 2.7% above the previous year and reaching a new record high production level for the month of November. Cheddar cheese production of 281.6 million pounds increased 5.9% YOY while other-than-cheddar cheese production increased 1.5% YOY throughout the month. The YOY increase in cheddar cheese production was the largest experienced throughout the past 16 months. ’15-’16 annual cheese production increased 2.3% to a new record high, despite cheddar cheese production declining by 0.1% throughout the period. Total cheese production is up an additional 1.9% YOY throughout the first two months of the ’16-’17 production season.
Cheese – Production Reaches Record High for the Month of November, Finishes up 2.7% YOY
Nov ’16 total U.S. cheese production of 1.01 billion pounds increased on a YOY basis for the 44th consecutive month, finishing 2.7% above the previous year and reaching a new record high production level for the month of November. Cheddar cheese production of 281.6 million pounds increased 5.9% YOY while other-than-cheddar cheese production increased 1.5% YOY throughout the month. The YOY increase in cheddar cheese production was the largest experienced throughout the past 16 months. ’15-’16 annual cheese production increased 2.3% to a new record high, despite cheddar cheese production declining by 0.1% throughout the period. Total cheese production is up an additional 1.9% YOY throughout the first two months of the ’16-’17 production season.
 Dry Whey – Production Declines Sharply, Finishes Down 6.9% YOY
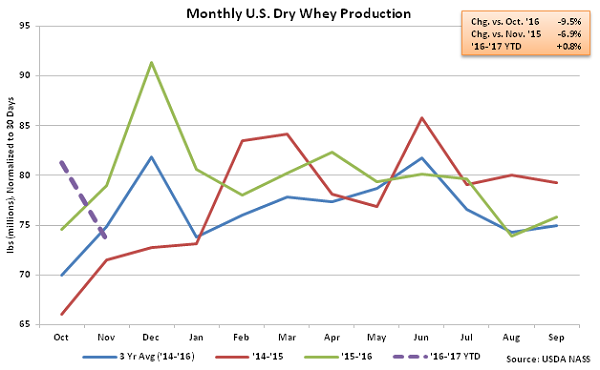
Nov ’16 U.S. dry whey production of 73.5 million pounds declined 9.5% MOM on a daily average basis and 6.9% YOY, finishing at a 22 month low. The YOY decline occurred despite previous year production volumes being revised 6.7% lower than previously stated. In addition to lower dry whey production, combined whey protein concentrate (WPC) and whey protein isolate (WPI) production remained lower on a YOY basis declining by 3.8% throughout the month. Combined WPC and WPI production has declined on a YOY basis over 23 of the past 24 months through November. Combined dry whey, WPC and WPI production declined on a YOY basis for the ninth time in the past ten months during Nov ’16, finishing down 5.7%. ’15-’16 annual dry whey production finished up 3.3% YOY, however combined production of dry whey, WPC and WPI declined 0.8%. Dry whey production remains up 0.8% YOY throughout the first two months of the ’16-’17 production season, despite the most recent YOY decline.
Dry Whey – Production Declines Sharply, Finishes Down 6.9% YOY
Nov ’16 U.S. dry whey production of 73.5 million pounds declined 9.5% MOM on a daily average basis and 6.9% YOY, finishing at a 22 month low. The YOY decline occurred despite previous year production volumes being revised 6.7% lower than previously stated. In addition to lower dry whey production, combined whey protein concentrate (WPC) and whey protein isolate (WPI) production remained lower on a YOY basis declining by 3.8% throughout the month. Combined WPC and WPI production has declined on a YOY basis over 23 of the past 24 months through November. Combined dry whey, WPC and WPI production declined on a YOY basis for the ninth time in the past ten months during Nov ’16, finishing down 5.7%. ’15-’16 annual dry whey production finished up 3.3% YOY, however combined production of dry whey, WPC and WPI declined 0.8%. Dry whey production remains up 0.8% YOY throughout the first two months of the ’16-’17 production season, despite the most recent YOY decline.
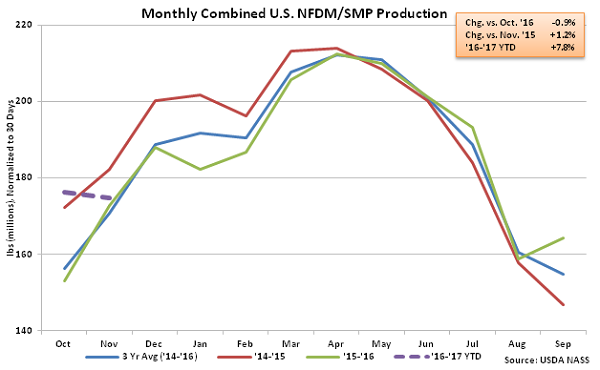
 NFDM/SMP – Higher SMP Production More Than Offsets Lower NFDM Production, Total up 1.2%
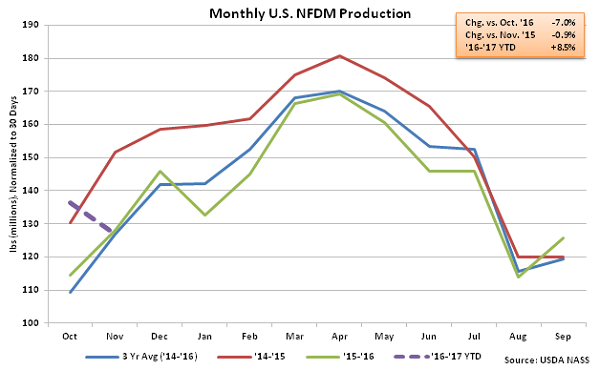
Nov ’16 U.S. nonfat dry milk (NFDM) production of 126.8 million pounds declined 7.0% MOM on a daily average basis and 0.9% YOY, finishing lower on a YOY basis for the first time in three months. Skim milk powder (SMP), which is more suited to the requirements of most global markets, increased on a YOY basis for the 13th consecutive month, however, as production of 48.1 million pounds finished 7.0% above the previous year. Overall, Nov ’16 combined production of NFDM and SMP increased 1.2% on a YOY basis, finishing at the second highest November figure on record. Combined production of NFDM and SMP has increased on a YOY basis over seven consecutive months through November. ’15-’16 annual combined production of NFDM and SMP finished 2.3% lower as a 8.4% decline in NFDM production more than offset a 24.1% increase in SMP production. ’16-’17 YTD combined production of NFDM and SMP has rebounded by 7.8% throughout the first two months of the production season.
NFDM/SMP – Higher SMP Production More Than Offsets Lower NFDM Production, Total up 1.2%
Nov ’16 U.S. nonfat dry milk (NFDM) production of 126.8 million pounds declined 7.0% MOM on a daily average basis and 0.9% YOY, finishing lower on a YOY basis for the first time in three months. Skim milk powder (SMP), which is more suited to the requirements of most global markets, increased on a YOY basis for the 13th consecutive month, however, as production of 48.1 million pounds finished 7.0% above the previous year. Overall, Nov ’16 combined production of NFDM and SMP increased 1.2% on a YOY basis, finishing at the second highest November figure on record. Combined production of NFDM and SMP has increased on a YOY basis over seven consecutive months through November. ’15-’16 annual combined production of NFDM and SMP finished 2.3% lower as a 8.4% decline in NFDM production more than offset a 24.1% increase in SMP production. ’16-’17 YTD combined production of NFDM and SMP has rebounded by 7.8% throughout the first two months of the production season.
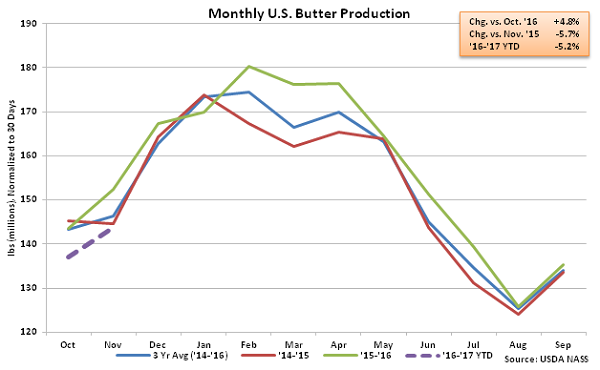
 Overall, skim milk powder production increased most significantly YOY on a percentage basis during Nov ’16, followed by cheddar cheese production, while dry whey and butter production declined most significantly on a percentage basis throughout the month.
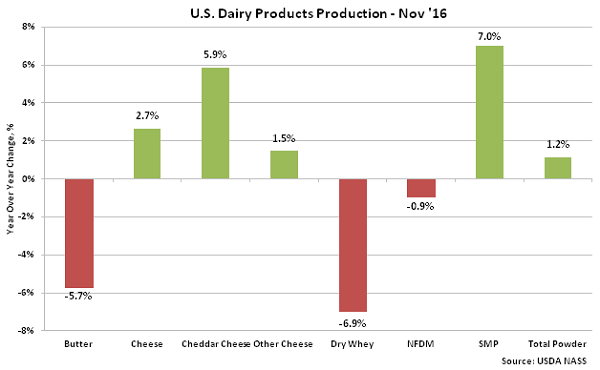
- Nov ’16 U.S. butter production declined on a YOY basis for the second consecutive month, finishing 5.7% below the previous year and reaching a six year seasonal low.
- U.S. cheese production remained strong during Nov ’16, increasing on a YOY basis for the 44th consecutive month and finishing at a record high volume for the month of November.
- Combined production of U.S. nonfat dry milk and skim milk powder remained higher on a YOY basis for the seventh consecutive month during Nov ’16, increasing by 1.2% as stronger skim milk powder production more than offset lower production of nonfat dry milk.
Cheese – Production Reaches Record High for the Month of November, Finishes up 2.7% YOY
Nov ’16 total U.S. cheese production of 1.01 billion pounds increased on a YOY basis for the 44th consecutive month, finishing 2.7% above the previous year and reaching a new record high production level for the month of November. Cheddar cheese production of 281.6 million pounds increased 5.9% YOY while other-than-cheddar cheese production increased 1.5% YOY throughout the month. The YOY increase in cheddar cheese production was the largest experienced throughout the past 16 months. ’15-’16 annual cheese production increased 2.3% to a new record high, despite cheddar cheese production declining by 0.1% throughout the period. Total cheese production is up an additional 1.9% YOY throughout the first two months of the ’16-’17 production season.
Dry Whey – Production Declines Sharply, Finishes Down 6.9% YOY
Nov ’16 U.S. dry whey production of 73.5 million pounds declined 9.5% MOM on a daily average basis and 6.9% YOY, finishing at a 22 month low. The YOY decline occurred despite previous year production volumes being revised 6.7% lower than previously stated. In addition to lower dry whey production, combined whey protein concentrate (WPC) and whey protein isolate (WPI) production remained lower on a YOY basis declining by 3.8% throughout the month. Combined WPC and WPI production has declined on a YOY basis over 23 of the past 24 months through November. Combined dry whey, WPC and WPI production declined on a YOY basis for the ninth time in the past ten months during Nov ’16, finishing down 5.7%. ’15-’16 annual dry whey production finished up 3.3% YOY, however combined production of dry whey, WPC and WPI declined 0.8%. Dry whey production remains up 0.8% YOY throughout the first two months of the ’16-’17 production season, despite the most recent YOY decline.
NFDM/SMP – Higher SMP Production More Than Offsets Lower NFDM Production, Total up 1.2%
Nov ’16 U.S. nonfat dry milk (NFDM) production of 126.8 million pounds declined 7.0% MOM on a daily average basis and 0.9% YOY, finishing lower on a YOY basis for the first time in three months. Skim milk powder (SMP), which is more suited to the requirements of most global markets, increased on a YOY basis for the 13th consecutive month, however, as production of 48.1 million pounds finished 7.0% above the previous year. Overall, Nov ’16 combined production of NFDM and SMP increased 1.2% on a YOY basis, finishing at the second highest November figure on record. Combined production of NFDM and SMP has increased on a YOY basis over seven consecutive months through November. ’15-’16 annual combined production of NFDM and SMP finished 2.3% lower as a 8.4% decline in NFDM production more than offset a 24.1% increase in SMP production. ’16-’17 YTD combined production of NFDM and SMP has rebounded by 7.8% throughout the first two months of the production season.
Overall, skim milk powder production increased most significantly YOY on a percentage basis during Nov ’16, followed by cheddar cheese production, while dry whey and butter production declined most significantly on a percentage basis throughout the month.