Atten Babler Dairy FX Indices – Jan ’17
The Atten Babler Commodities Dairy Foreign Exchange (FX) Indices continued to remain at elevated levels throughout Dec ’16. The USD/Dairy Exporter FX Index and USD/Domestic Dairy Importer FX Index each finished at record high levels throughout the month, while the USD/Dairy Importer FX Index was flat but remained at the eight month high levels experienced throughout the previous month.
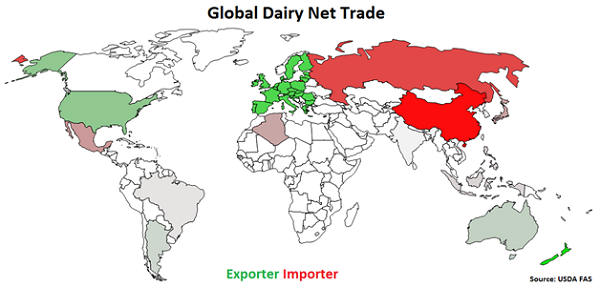
Global Dairy Net Trade:
Major net dairy exporters are led by New Zealand, followed by the EU-28, the U.S., Australia and Argentina (represented in green in the chart below). Major net dairy importers are led by China, followed by Russia, Mexico, Japan, Indonesia, Algeria and the Philippines (represented in red in the chart below).
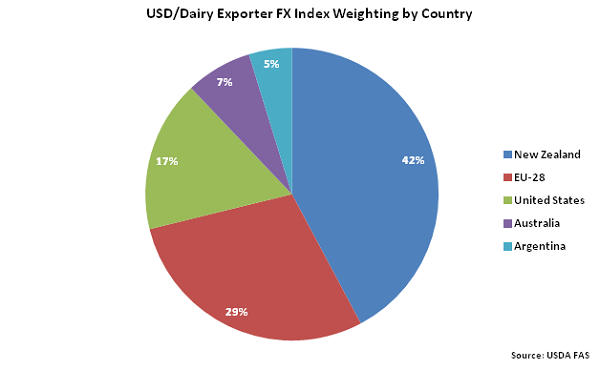
 New Zealand accounts for over two fifths of the USD/Dairy Exporter FX Index, followed by the EU-28 at 29% and the United States at 17%. Australia and Argentina each account for between 5-10% of the index.
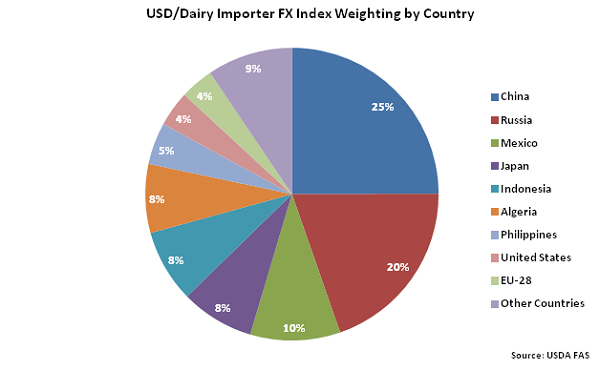
 China accounts for a quarter of the USD/Dairy Importer FX Index while Russia accounts for a fifth. Mexico, Japan, Indonesia, Algeria and the Philippines each account for between 5-10% of the index.
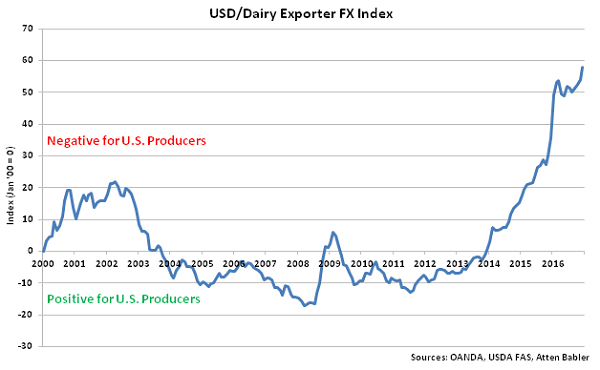
 USD/Dairy Exporter FX Index:
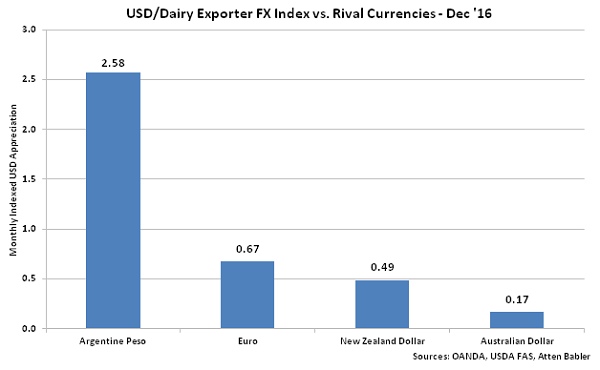
The USD/Dairy Exporter FX Index increased 3.9 points during Dec ’16, finishing at a record high value of 57.9. The USD/Dairy Exporter FX Index has increased 6.1 points throughout the past six months and 57.7 points since the beginning of 2014. A strong USD/Dairy Exporter FX Index reduces the competitiveness of U.S. dairy products relative to other exporting regions (represented in green in the Global Dairy Net Trade chart), ultimately resulting in less foreign demand for U.S. products, all other factors being equal. USD appreciation against the Argentine peso has accounted for the majority of the gains since the beginning of 2014.
USD/Dairy Exporter FX Index:
The USD/Dairy Exporter FX Index increased 3.9 points during Dec ’16, finishing at a record high value of 57.9. The USD/Dairy Exporter FX Index has increased 6.1 points throughout the past six months and 57.7 points since the beginning of 2014. A strong USD/Dairy Exporter FX Index reduces the competitiveness of U.S. dairy products relative to other exporting regions (represented in green in the Global Dairy Net Trade chart), ultimately resulting in less foreign demand for U.S. products, all other factors being equal. USD appreciation against the Argentine peso has accounted for the majority of the gains since the beginning of 2014.
 USD appreciation within the USD/Dairy Exporter FX Index during Dec ’16 was led by gains against the Argentine peso, followed by USD appreciation against the euro, New Zealand dollar and Australian dollar.
 USD/Dairy Importer FX Index:
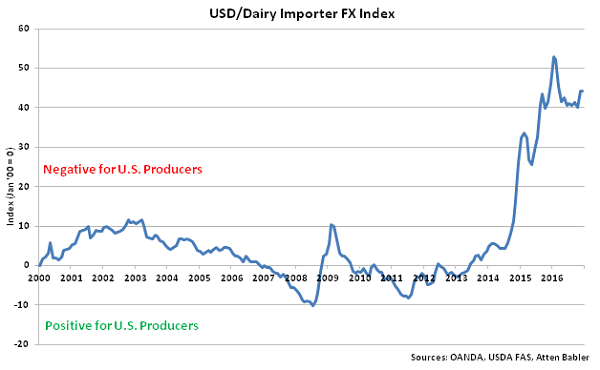
The USD/Dairy Importer FX Index was flat during Dec ’16, remaining at an eight month high value of 44.2. The USD/Dairy Importer FX Index has increased 3.6 points throughout the past six months and 40.6 points since the beginning of 2014. A strong USD/Dairy Importer FX Index results in less purchasing power for major dairy importing countries (represented in red in the Global Dairy Net Trade chart), making U.S. dairy products more expensive to import. USD appreciation against the Russian ruble has accounted for the majority of the gains since the beginning of 2014.
USD/Dairy Importer FX Index:
The USD/Dairy Importer FX Index was flat during Dec ’16, remaining at an eight month high value of 44.2. The USD/Dairy Importer FX Index has increased 3.6 points throughout the past six months and 40.6 points since the beginning of 2014. A strong USD/Dairy Importer FX Index results in less purchasing power for major dairy importing countries (represented in red in the Global Dairy Net Trade chart), making U.S. dairy products more expensive to import. USD appreciation against the Russian ruble has accounted for the majority of the gains since the beginning of 2014.
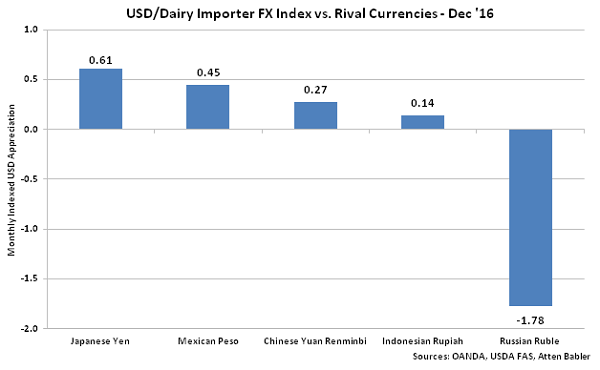
 USD appreciation within the USD/Dairy Importer FX Index during Dec ’16 was led by gains against the Japanese yen, followed by USD appreciation against the Mexican peso, Chinese yuan renminbi and Indonesian rupiah. USD declines were exhibited against the Russian ruble.
 U.S. Dairy Export Destinations:
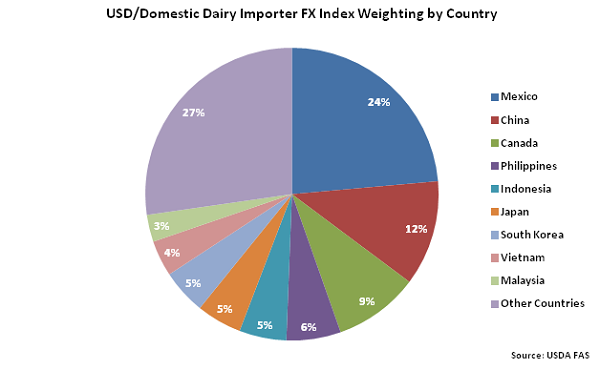
Major destinations for U.S. dairy exports are led by Mexico, followed by China, Canada, the Philippines, Indonesia, Japan and South Korea.
U.S. Dairy Export Destinations:
Major destinations for U.S. dairy exports are led by Mexico, followed by China, Canada, the Philippines, Indonesia, Japan and South Korea.
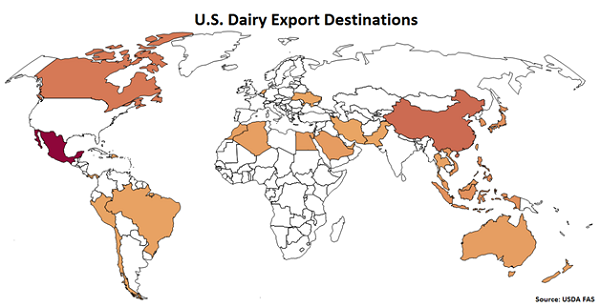 Mexico accounts for nearly a quarter of the USD/Domestic Dairy Importer FX Index, followed by China at 12%. Canada, the Philippines, Indonesia, Japan and South Korea each account for between 5-10% of the index.
 USD/Domestic Dairy Importer FX Index:
The USD/Domestic Dairy Importer FX Index increased 4.2 points during Dec ’16, finishing at a record high value of 61.7. The USD/Domestic Dairy Importer FX Index has increased 15.0 points throughout the past six months and 41.9 points since the beginning of 2014. A strong USD/Domestic Dairy Importer FX Index results in less purchasing power for the traditional buyers of U.S. dairy products (represented in red in the U.S. Dairy Export Destinations chart), ultimately resulting in less foreign demand for U.S. products, all other factors being equal. USD appreciation against the Mexican peso and Egyptian pound has accounted for the majority of the gains since the beginning of 2014.
USD/Domestic Dairy Importer FX Index:
The USD/Domestic Dairy Importer FX Index increased 4.2 points during Dec ’16, finishing at a record high value of 61.7. The USD/Domestic Dairy Importer FX Index has increased 15.0 points throughout the past six months and 41.9 points since the beginning of 2014. A strong USD/Domestic Dairy Importer FX Index results in less purchasing power for the traditional buyers of U.S. dairy products (represented in red in the U.S. Dairy Export Destinations chart), ultimately resulting in less foreign demand for U.S. products, all other factors being equal. USD appreciation against the Mexican peso and Egyptian pound has accounted for the majority of the gains since the beginning of 2014.
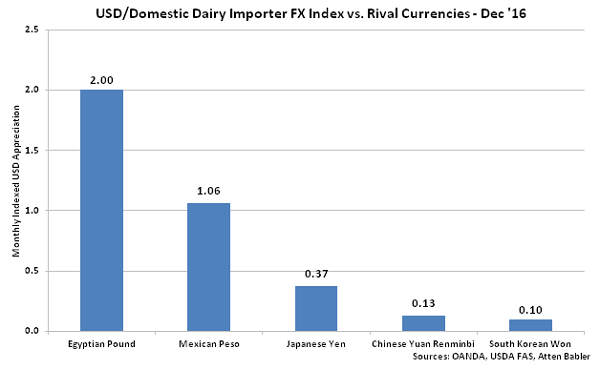
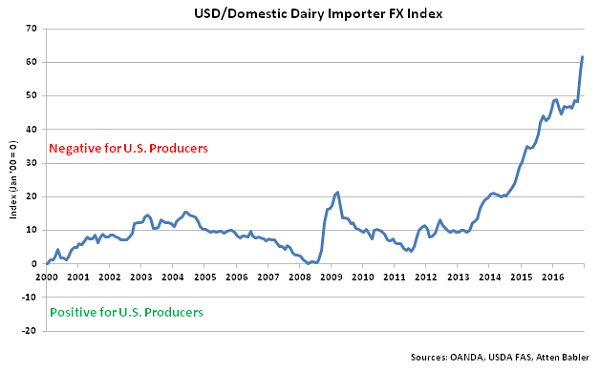 USD appreciation within the USD/Domestic Dairy Importer FX Index during Dec ’16 was led by gains against the Egyptian pound, followed by USD appreciation against the Mexican peso, Japanese yen, Chinese yuan renminbi and South Korean won.
New Zealand accounts for over two fifths of the USD/Dairy Exporter FX Index, followed by the EU-28 at 29% and the United States at 17%. Australia and Argentina each account for between 5-10% of the index.
China accounts for a quarter of the USD/Dairy Importer FX Index while Russia accounts for a fifth. Mexico, Japan, Indonesia, Algeria and the Philippines each account for between 5-10% of the index.
USD/Dairy Exporter FX Index:
The USD/Dairy Exporter FX Index increased 3.9 points during Dec ’16, finishing at a record high value of 57.9. The USD/Dairy Exporter FX Index has increased 6.1 points throughout the past six months and 57.7 points since the beginning of 2014. A strong USD/Dairy Exporter FX Index reduces the competitiveness of U.S. dairy products relative to other exporting regions (represented in green in the Global Dairy Net Trade chart), ultimately resulting in less foreign demand for U.S. products, all other factors being equal. USD appreciation against the Argentine peso has accounted for the majority of the gains since the beginning of 2014.
USD appreciation within the USD/Dairy Exporter FX Index during Dec ’16 was led by gains against the Argentine peso, followed by USD appreciation against the euro, New Zealand dollar and Australian dollar.
USD/Dairy Importer FX Index:
The USD/Dairy Importer FX Index was flat during Dec ’16, remaining at an eight month high value of 44.2. The USD/Dairy Importer FX Index has increased 3.6 points throughout the past six months and 40.6 points since the beginning of 2014. A strong USD/Dairy Importer FX Index results in less purchasing power for major dairy importing countries (represented in red in the Global Dairy Net Trade chart), making U.S. dairy products more expensive to import. USD appreciation against the Russian ruble has accounted for the majority of the gains since the beginning of 2014.
USD appreciation within the USD/Dairy Importer FX Index during Dec ’16 was led by gains against the Japanese yen, followed by USD appreciation against the Mexican peso, Chinese yuan renminbi and Indonesian rupiah. USD declines were exhibited against the Russian ruble.
U.S. Dairy Export Destinations:
Major destinations for U.S. dairy exports are led by Mexico, followed by China, Canada, the Philippines, Indonesia, Japan and South Korea.
Mexico accounts for nearly a quarter of the USD/Domestic Dairy Importer FX Index, followed by China at 12%. Canada, the Philippines, Indonesia, Japan and South Korea each account for between 5-10% of the index.
USD/Domestic Dairy Importer FX Index:
The USD/Domestic Dairy Importer FX Index increased 4.2 points during Dec ’16, finishing at a record high value of 61.7. The USD/Domestic Dairy Importer FX Index has increased 15.0 points throughout the past six months and 41.9 points since the beginning of 2014. A strong USD/Domestic Dairy Importer FX Index results in less purchasing power for the traditional buyers of U.S. dairy products (represented in red in the U.S. Dairy Export Destinations chart), ultimately resulting in less foreign demand for U.S. products, all other factors being equal. USD appreciation against the Mexican peso and Egyptian pound has accounted for the majority of the gains since the beginning of 2014.
USD appreciation within the USD/Domestic Dairy Importer FX Index during Dec ’16 was led by gains against the Egyptian pound, followed by USD appreciation against the Mexican peso, Japanese yen, Chinese yuan renminbi and South Korean won.