U.S. Dairy Cold Storage Update – Nov ’16
U.S. Dairy Cold Storage Update – Nov ’16
Executive Summary
U.S. cold storage figures provided by USDA were recently updated with values spanning through Oct ’16. Highlights from the updated report include:
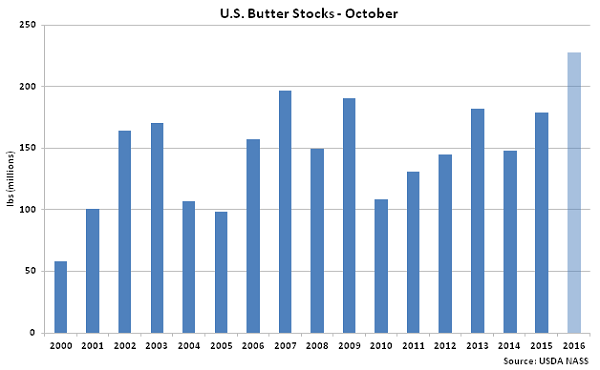
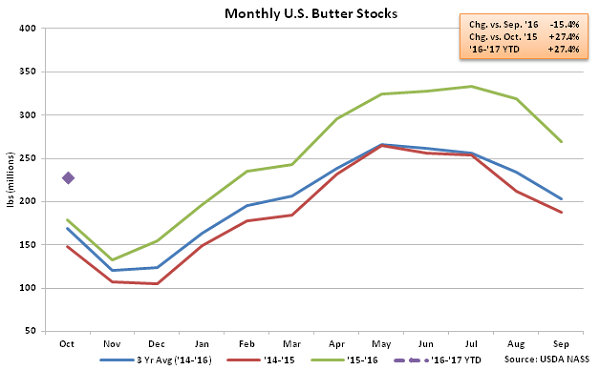 According to USDA, Oct ’16 U.S. butter stocks of 227.7 million pounds declined 15.4% MOM seasonally but remained significantly higher on a YOY basis, finishing up 27.4% to a 23 year high for the month of October. Butter stocks have increased on a YOY basis for 19 consecutive months through October. The September – October seasonal decline in butter stocks of 41.4 million pounds was larger than the ten year average September – October decline of 30.8 million pounds however the seasonal declines were largely equal on a percentage basis. Butter stocks have declined by an average of 15.7% from September – October over the past ten years.
U.S. butter stocks typically reach their seasonal peak in May, followed by seasonal drawdowns until lows are reached during the winter months. The most recent seasonal drawdown in butter stocks of 132.1 million pounds was 11.7% less than the previous three year average seasonal drawdown as weak export demand outweighed increases in domestic consumption. U.S. butterfat exports had declined YOY for 20 consecutive months through Dec ’15.
According to USDA, Oct ’16 U.S. butter stocks of 227.7 million pounds declined 15.4% MOM seasonally but remained significantly higher on a YOY basis, finishing up 27.4% to a 23 year high for the month of October. Butter stocks have increased on a YOY basis for 19 consecutive months through October. The September – October seasonal decline in butter stocks of 41.4 million pounds was larger than the ten year average September – October decline of 30.8 million pounds however the seasonal declines were largely equal on a percentage basis. Butter stocks have declined by an average of 15.7% from September – October over the past ten years.
U.S. butter stocks typically reach their seasonal peak in May, followed by seasonal drawdowns until lows are reached during the winter months. The most recent seasonal drawdown in butter stocks of 132.1 million pounds was 11.7% less than the previous three year average seasonal drawdown as weak export demand outweighed increases in domestic consumption. U.S. butterfat exports had declined YOY for 20 consecutive months through Dec ’15.
 Cheese – Stocks Reach a 33 Year Seasonal High, Finish up 6.1% YOY
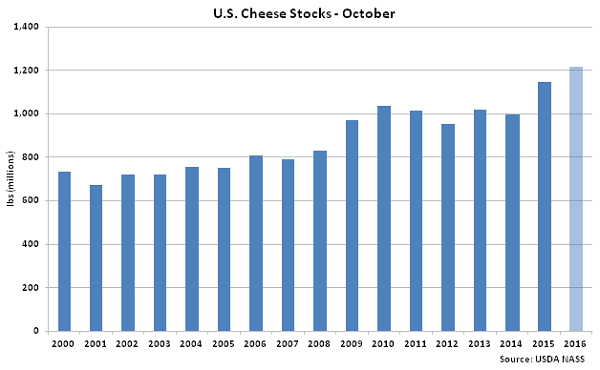
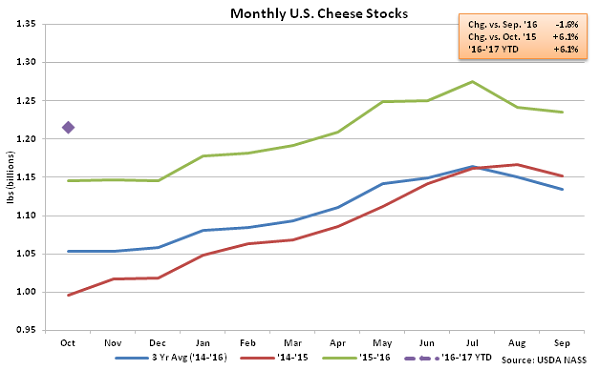 Oct ’16 U.S. cheese stocks of 1.22 billion pounds declined 1.6% MOM but remained 6.1% higher on a YOY basis, finishing at a 33 year seasonal high for the month of October. The monthly YOY increase in cheese stocks was the 24th experienced in a row while the MOM decline was smaller than the typical seasonal September – October drawdown on a percentage basis. Cheese stocks have declined by an average of 2.6% from September – October over the past ten years. Cheese stocks have remained higher on a YOY basis in recent months as milk production has remained strong in Midwestern cheese producing states while weakness in cheese export markets has continued. Strong cheese production has been partially offset by continued strong domestic demand, however cheese exports remained weak through Oct ’16.
U.S. cheese stocks typically exhibit a smaller degree of MOM and YOY variation than U.S. butter stocks. Cheese stocks do not have as large of a seasonal build as butter stocks, with the five year average November – October seasonal build in cheese stocks representing a 12.7% increase in stocks vs. a 121.1% increase in butter stocks. The reduced seasonality exhibited in U.S. cheese stocks has led to less volatile YOY variation, with cheese stocks having a five year average absolute YOY change of 5.3% compared to 26.3% for U.S. butter stocks.
Oct ’16 U.S. cheese stocks of 1.22 billion pounds declined 1.6% MOM but remained 6.1% higher on a YOY basis, finishing at a 33 year seasonal high for the month of October. The monthly YOY increase in cheese stocks was the 24th experienced in a row while the MOM decline was smaller than the typical seasonal September – October drawdown on a percentage basis. Cheese stocks have declined by an average of 2.6% from September – October over the past ten years. Cheese stocks have remained higher on a YOY basis in recent months as milk production has remained strong in Midwestern cheese producing states while weakness in cheese export markets has continued. Strong cheese production has been partially offset by continued strong domestic demand, however cheese exports remained weak through Oct ’16.
U.S. cheese stocks typically exhibit a smaller degree of MOM and YOY variation than U.S. butter stocks. Cheese stocks do not have as large of a seasonal build as butter stocks, with the five year average November – October seasonal build in cheese stocks representing a 12.7% increase in stocks vs. a 121.1% increase in butter stocks. The reduced seasonality exhibited in U.S. cheese stocks has led to less volatile YOY variation, with cheese stocks having a five year average absolute YOY change of 5.3% compared to 26.3% for U.S. butter stocks.
- Oct ’16 U.S. butter stocks continued to decline seasonally but remained significantly higher on a YOY basis, finishing 27.4% above the previous year’s level and reaching a 23 year seasonal high.
- Oct ’16 U.S. cheese stocks also remained higher on a YOY basis, finishing up 6.1% to a 33 year seasonal high.
According to USDA, Oct ’16 U.S. butter stocks of 227.7 million pounds declined 15.4% MOM seasonally but remained significantly higher on a YOY basis, finishing up 27.4% to a 23 year high for the month of October. Butter stocks have increased on a YOY basis for 19 consecutive months through October. The September – October seasonal decline in butter stocks of 41.4 million pounds was larger than the ten year average September – October decline of 30.8 million pounds however the seasonal declines were largely equal on a percentage basis. Butter stocks have declined by an average of 15.7% from September – October over the past ten years.
U.S. butter stocks typically reach their seasonal peak in May, followed by seasonal drawdowns until lows are reached during the winter months. The most recent seasonal drawdown in butter stocks of 132.1 million pounds was 11.7% less than the previous three year average seasonal drawdown as weak export demand outweighed increases in domestic consumption. U.S. butterfat exports had declined YOY for 20 consecutive months through Dec ’15.
Cheese – Stocks Reach a 33 Year Seasonal High, Finish up 6.1% YOY
Oct ’16 U.S. cheese stocks of 1.22 billion pounds declined 1.6% MOM but remained 6.1% higher on a YOY basis, finishing at a 33 year seasonal high for the month of October. The monthly YOY increase in cheese stocks was the 24th experienced in a row while the MOM decline was smaller than the typical seasonal September – October drawdown on a percentage basis. Cheese stocks have declined by an average of 2.6% from September – October over the past ten years. Cheese stocks have remained higher on a YOY basis in recent months as milk production has remained strong in Midwestern cheese producing states while weakness in cheese export markets has continued. Strong cheese production has been partially offset by continued strong domestic demand, however cheese exports remained weak through Oct ’16.
U.S. cheese stocks typically exhibit a smaller degree of MOM and YOY variation than U.S. butter stocks. Cheese stocks do not have as large of a seasonal build as butter stocks, with the five year average November – October seasonal build in cheese stocks representing a 12.7% increase in stocks vs. a 121.1% increase in butter stocks. The reduced seasonality exhibited in U.S. cheese stocks has led to less volatile YOY variation, with cheese stocks having a five year average absolute YOY change of 5.3% compared to 26.3% for U.S. butter stocks.