Atten Babler Meat FX Indices – Oct ’16
The Atten Babler Commodities Meat Foreign Exchange (FX) Indices strengthened throughout Sep ’16, remaining at or near record highs. The USD/Domestic Meat Importer FX Index increased the most throughout the month, followed by the USD/Meat Exporter FX Index and the USD/Meat Importer FX Index.
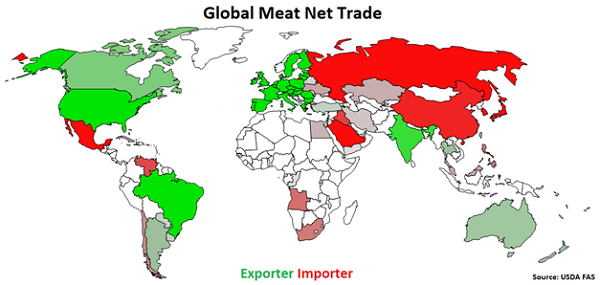
Global Meat Net Trade:
Major net meat exporters are led by Brazil, followed by the U.S., the EU-28, India and Australia (represented in green in the chart below). Major net meat importers are led by Japan, followed by Russia, Mexico, Hong Kong and Saudi Arabia (represented in red in the chart below).
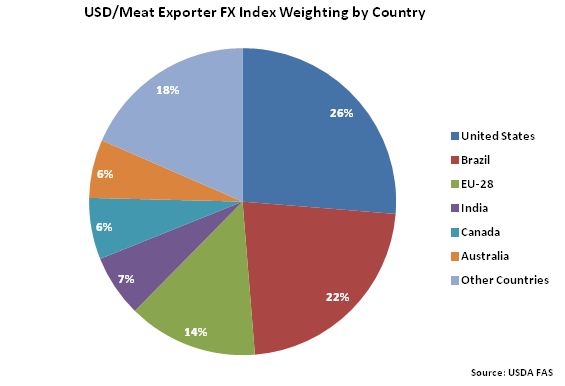
 The United States accounts for over a quarter of the USD/Meat Exporter FX Index, followed by Brazil at 22% and the EU-28 at 14%. India, Canada and Australia each account for between 5-10% of the index.
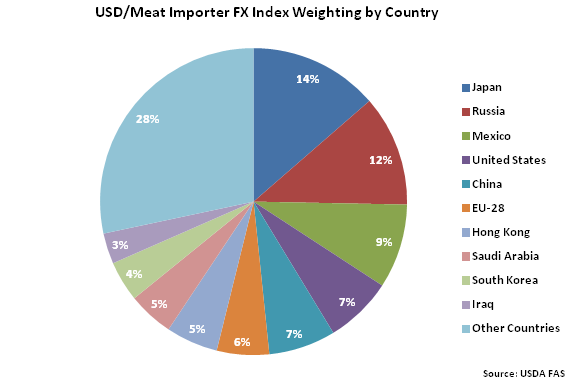
 Japan accounts for 14% of the USD/Meat Importer FX Index, followed by Russia at 12%. Mexico, the United States, China, the EU-28, Hong Kong and Saudi Arabia each account for between 5-10% of the index.
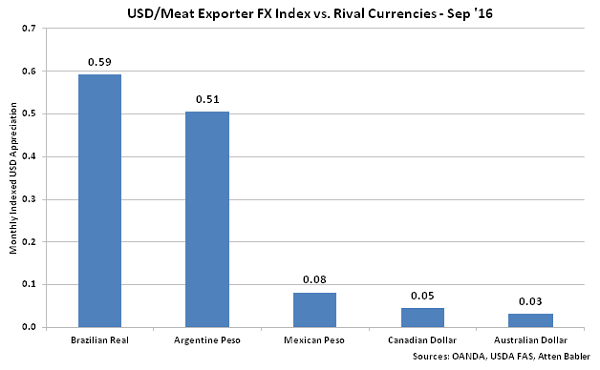
 USD/Meat Exporter FX Index:
The USD/Meat Exporter FX Index increased 1.2 points during Sep ’16, finishing at a value of 89.1. The USD/Meat Exporter FX Index remains down 7.5 points throughout the past six months but has increased by 57.2 points since the beginning of 2014. A strong USD/Meat Exporter FX Index reduces the competitiveness of U.S. meat relative to other exporting regions (represented in green in the Global Meat Net Trade chart), ultimately resulting in less foreign demand, all other factors being equal. USD appreciation against the Belarusian ruble and Argentine peso has accounted for the majority of the gains since the beginning of 2014.
USD/Meat Exporter FX Index:
The USD/Meat Exporter FX Index increased 1.2 points during Sep ’16, finishing at a value of 89.1. The USD/Meat Exporter FX Index remains down 7.5 points throughout the past six months but has increased by 57.2 points since the beginning of 2014. A strong USD/Meat Exporter FX Index reduces the competitiveness of U.S. meat relative to other exporting regions (represented in green in the Global Meat Net Trade chart), ultimately resulting in less foreign demand, all other factors being equal. USD appreciation against the Belarusian ruble and Argentine peso has accounted for the majority of the gains since the beginning of 2014.
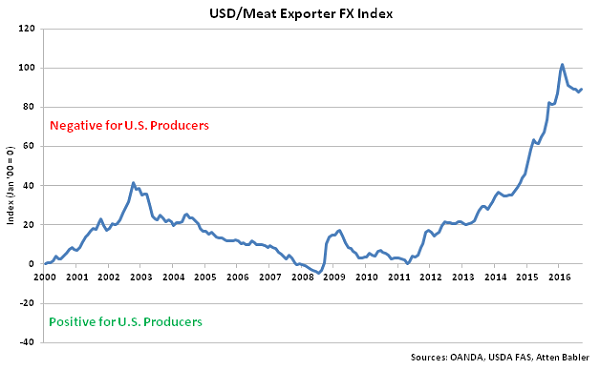 USD appreciation within the USD/Meat Exporter FX Index during Sep ’16 was led by gains against the Brazilian real, followed by USD appreciation against the Argentine peso, Mexican peso, Canadian dollar and Australian dollar.
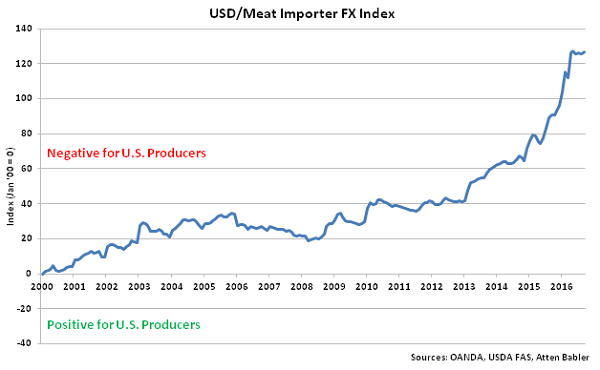
 USD/Meat Importer FX Index:
The USD/Meat Importer FX Index increased 1.1 points during Sep ’16, finishing at a value of 126.6. The USD/Meat Importer FX Index has increased 65.4 points since the beginning of 2014 and 14.7 points throughout the past six months. A strong USD/Meat Importer FX Index results in less purchasing power for major meat importing countries (represented in red in the Global Meat Net Trade chart), making U.S. meat more expensive to import. USD appreciation against the Venezuelan bolivar and Angolan kwanza has accounted for the majority of the gains since the beginning of 2014.
USD/Meat Importer FX Index:
The USD/Meat Importer FX Index increased 1.1 points during Sep ’16, finishing at a value of 126.6. The USD/Meat Importer FX Index has increased 65.4 points since the beginning of 2014 and 14.7 points throughout the past six months. A strong USD/Meat Importer FX Index results in less purchasing power for major meat importing countries (represented in red in the Global Meat Net Trade chart), making U.S. meat more expensive to import. USD appreciation against the Venezuelan bolivar and Angolan kwanza has accounted for the majority of the gains since the beginning of 2014.
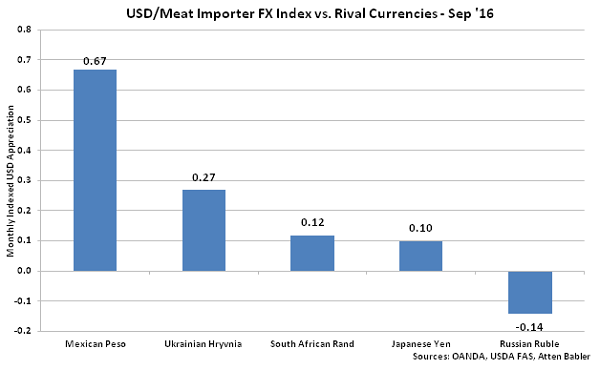
 USD appreciation within the USD/Meat Importer FX Index during Sep ’16 was led by gains against the Mexican peso, followed by USD appreciation against the Ukrainian hryvnia, South African rand and Japanese yen. USD declines were exhibited against the Russian ruble.
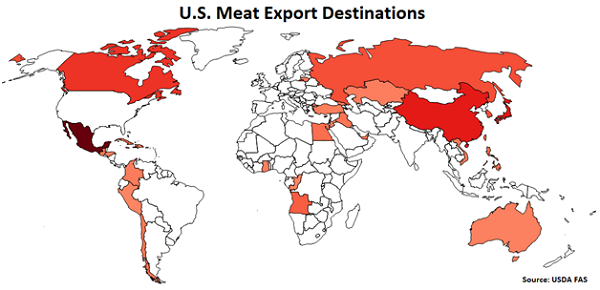
 U.S. Meat Export Destinations:
Major destinations for U.S. meat exports are led by Mexico, followed by Japan, China, Canada, and Hong Kong.
U.S. Meat Export Destinations:
Major destinations for U.S. meat exports are led by Mexico, followed by Japan, China, Canada, and Hong Kong.
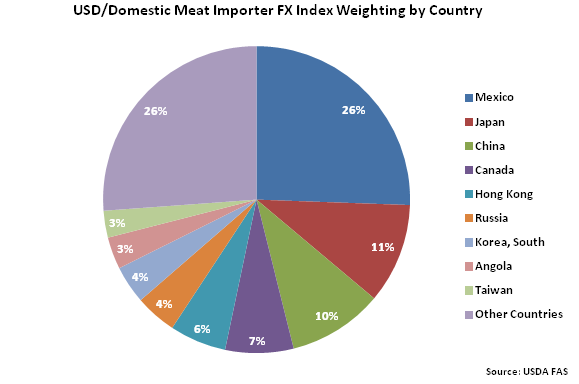
 Mexico accounts for over a quarter of the USD/Domestic Meat Importer FX Index, followed by Japan at 11%. China, Canada and Hong Kong each account for between 5-10% of the index.
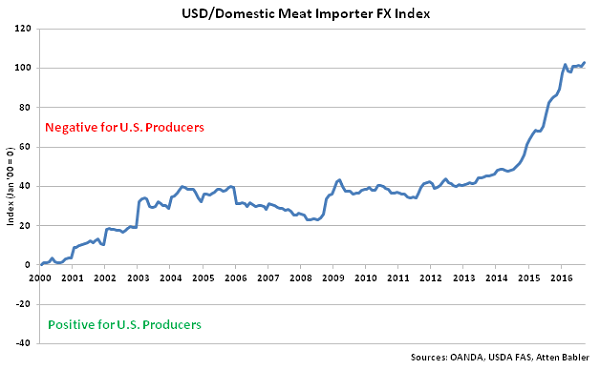
 USD/Domestic Meat Importer FX Index:
The USD/Domestic Meat Importer FX Index increased 2.1 points in Sep ’16, finishing at a record high value of 102.9. The USD/Domestic Meat Importer FX Index has increased 56.5 points since the beginning of 2014 and 4.4 points throughout the past six months. A strong USD/Domestic Meat Importer FX Index results in less purchasing power for the traditional buyers of U.S. meat (represented in red in the U.S. Meat Export Destinations chart), ultimately resulting in less foreign demand, all other factors being equal. USD appreciation against the Angolan kwanza and Mexican peso has accounted for the majority of the gains since the beginning of 2014.
USD/Domestic Meat Importer FX Index:
The USD/Domestic Meat Importer FX Index increased 2.1 points in Sep ’16, finishing at a record high value of 102.9. The USD/Domestic Meat Importer FX Index has increased 56.5 points since the beginning of 2014 and 4.4 points throughout the past six months. A strong USD/Domestic Meat Importer FX Index results in less purchasing power for the traditional buyers of U.S. meat (represented in red in the U.S. Meat Export Destinations chart), ultimately resulting in less foreign demand, all other factors being equal. USD appreciation against the Angolan kwanza and Mexican peso has accounted for the majority of the gains since the beginning of 2014.
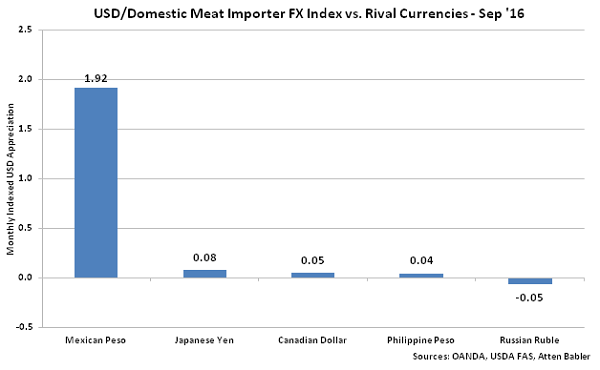
 USD appreciation within the USD/Domestic Meat Importer FX Index during Sep ’16 was led by gains against the Mexican peso, followed by USD appreciation against the Japanese yen, Canadian dollar and Philippine peso. USD declines were exhibited against the Russian ruble.
The United States accounts for over a quarter of the USD/Meat Exporter FX Index, followed by Brazil at 22% and the EU-28 at 14%. India, Canada and Australia each account for between 5-10% of the index.
Japan accounts for 14% of the USD/Meat Importer FX Index, followed by Russia at 12%. Mexico, the United States, China, the EU-28, Hong Kong and Saudi Arabia each account for between 5-10% of the index.
USD/Meat Exporter FX Index:
The USD/Meat Exporter FX Index increased 1.2 points during Sep ’16, finishing at a value of 89.1. The USD/Meat Exporter FX Index remains down 7.5 points throughout the past six months but has increased by 57.2 points since the beginning of 2014. A strong USD/Meat Exporter FX Index reduces the competitiveness of U.S. meat relative to other exporting regions (represented in green in the Global Meat Net Trade chart), ultimately resulting in less foreign demand, all other factors being equal. USD appreciation against the Belarusian ruble and Argentine peso has accounted for the majority of the gains since the beginning of 2014.
USD appreciation within the USD/Meat Exporter FX Index during Sep ’16 was led by gains against the Brazilian real, followed by USD appreciation against the Argentine peso, Mexican peso, Canadian dollar and Australian dollar.
USD/Meat Importer FX Index:
The USD/Meat Importer FX Index increased 1.1 points during Sep ’16, finishing at a value of 126.6. The USD/Meat Importer FX Index has increased 65.4 points since the beginning of 2014 and 14.7 points throughout the past six months. A strong USD/Meat Importer FX Index results in less purchasing power for major meat importing countries (represented in red in the Global Meat Net Trade chart), making U.S. meat more expensive to import. USD appreciation against the Venezuelan bolivar and Angolan kwanza has accounted for the majority of the gains since the beginning of 2014.
USD appreciation within the USD/Meat Importer FX Index during Sep ’16 was led by gains against the Mexican peso, followed by USD appreciation against the Ukrainian hryvnia, South African rand and Japanese yen. USD declines were exhibited against the Russian ruble.
U.S. Meat Export Destinations:
Major destinations for U.S. meat exports are led by Mexico, followed by Japan, China, Canada, and Hong Kong.
Mexico accounts for over a quarter of the USD/Domestic Meat Importer FX Index, followed by Japan at 11%. China, Canada and Hong Kong each account for between 5-10% of the index.
USD/Domestic Meat Importer FX Index:
The USD/Domestic Meat Importer FX Index increased 2.1 points in Sep ’16, finishing at a record high value of 102.9. The USD/Domestic Meat Importer FX Index has increased 56.5 points since the beginning of 2014 and 4.4 points throughout the past six months. A strong USD/Domestic Meat Importer FX Index results in less purchasing power for the traditional buyers of U.S. meat (represented in red in the U.S. Meat Export Destinations chart), ultimately resulting in less foreign demand, all other factors being equal. USD appreciation against the Angolan kwanza and Mexican peso has accounted for the majority of the gains since the beginning of 2014.
USD appreciation within the USD/Domestic Meat Importer FX Index during Sep ’16 was led by gains against the Mexican peso, followed by USD appreciation against the Japanese yen, Canadian dollar and Philippine peso. USD declines were exhibited against the Russian ruble.