U.S. Livestock Cold Storage Update – Jul ’16
Executive Summary
U.S. cold storage figures provided by USDA were recently updated with values spanning through Jun ’16. Highlights from the updated report include:
• U.S. pork and beef stocks each declined on a YOY basis for the fifth consecutive month during Jun ’16 but remained within 10% of historical maximum storage levels for the month of June.
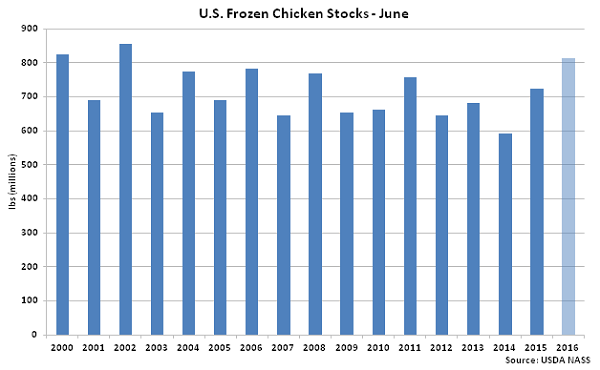
• U.S. chicken stocks remained higher on a YOY basis for the 19th consecutive month during Jun ’16, finishing up 12.5% to a 14 year high for the month of June.
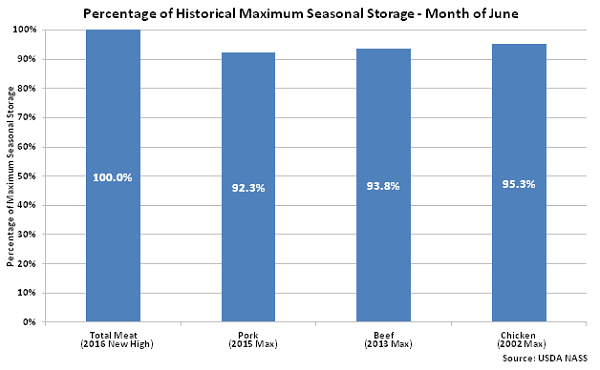
• Jun ’16 combined U.S. pork, beef and chicken remained 5.9% below the monthly record high experienced in Oct ’15 but finished at a record high seasonal level for the month of June.
Additional Report Details
Pork – Stocks Decline on a YOY Basis for the Fifth Consecutive Month, Finish Down 7.7%
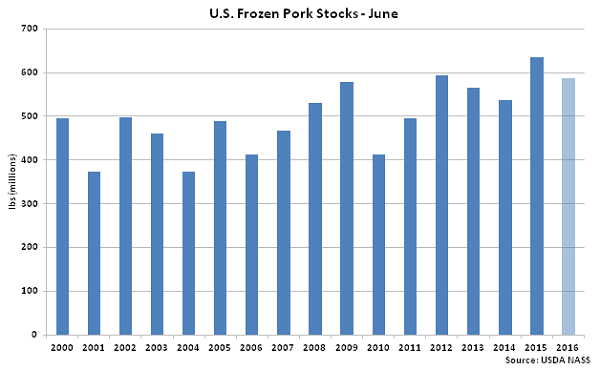
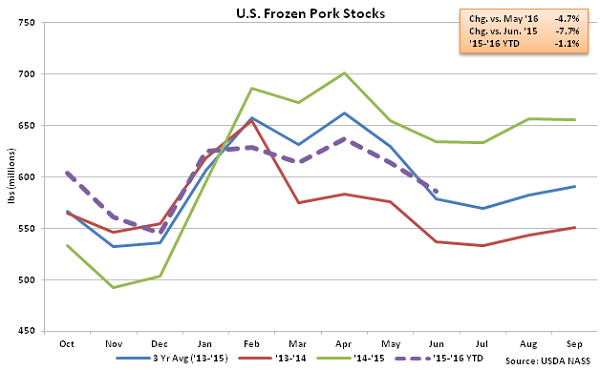 According to USDA, Jun ’16 U.S. frozen pork stocks of 585.9 million pounds declined 4.7% MOM and 7.7% YOY, finishing at a six month low. Pork stocks had increased YOY for 12 consecutive months prior to the five most recent YOY declines experienced from Feb ’16 – Jun ’16. The MOM decline in pork stocks of 28.6 million pounds, or 4.7%, was smaller than the ten year average May – June seasonal decline in stocks of 42.7 million pounds, or 7.6%, however, while Jun ’16 pork stocks finished 1.3% above three year average figures for the month of June.
 Beef – Stocks Remain Lower on a YOY Basis for the Fifth Consecutive Month, Finish Down 4.9%
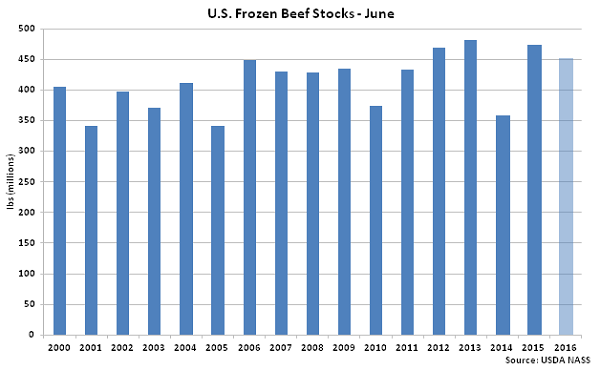
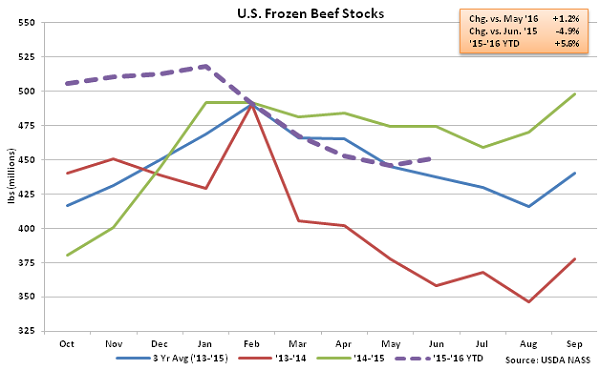 Jun ’16 U.S. frozen beef stocks of 451.2 million pounds increased 1.2% MOM from the 17 month low experienced during the previous month but remained lower on a YOY basis for the fifth consecutive month, finishing down 4.9%. Beef stocks had increased YOY for 14 consecutive months prior to the five most recent YOY declines experienced from Feb ’16 – Jun ’16. Despite remaining lower on a YOY basis, Jun ’16 beef stocks remain 3.0% above three year average figures for the month of June.
 Chicken – Stocks Reach a 14 Year High for the Month of June, Finish up 12.5% YOY
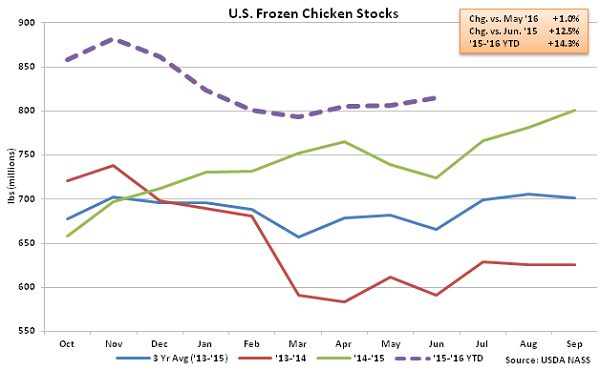 Jun ’16 U.S. frozen chicken stocks of 814.8 million pounds increased 1.0% MOM and 12.5% YOY, finishing at a 14 year high for the month of June. Chicken stocks have increased on a YOY basis for 19 months in a row after nine consecutive months of YOY declines were experienced from Mar ’14 – Nov ’14. Stocks have built as the Russian import ban continues to negatively affect U.S. broiler exports. U.S. broiler export volumes have declined by 9.4% YOY since the ban was announced. Jun ’16 chicken stocks finished 22.4% higher than three year average figures for the month of June.
 Overall, combined Jun ’16 U.S. pork, beef and chicken stocks remained 5.9% below the monthly record high experienced in Oct ’15. Individually, Jun ’16 U.S. pork, beef and chicken stocks finished within 12-17% of historical maximum storage levels.
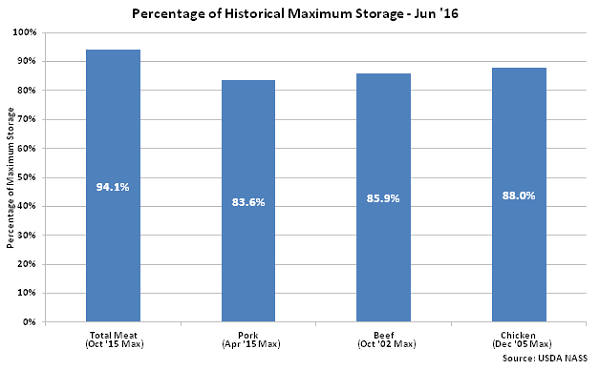 Jun ’16 combined U.S. pork, beef and chicken stocks finished at a record high seasonal storage level for the month of June. Pork and beef stocks each finished within 10% of historical maximum storage levels for the month of June while chicken stocks finished within 5% of historical June storage levels.
According to USDA, Jun ’16 U.S. frozen pork stocks of 585.9 million pounds declined 4.7% MOM and 7.7% YOY, finishing at a six month low. Pork stocks had increased YOY for 12 consecutive months prior to the five most recent YOY declines experienced from Feb ’16 – Jun ’16. The MOM decline in pork stocks of 28.6 million pounds, or 4.7%, was smaller than the ten year average May – June seasonal decline in stocks of 42.7 million pounds, or 7.6%, however, while Jun ’16 pork stocks finished 1.3% above three year average figures for the month of June.
Beef – Stocks Remain Lower on a YOY Basis for the Fifth Consecutive Month, Finish Down 4.9%
Jun ’16 U.S. frozen beef stocks of 451.2 million pounds increased 1.2% MOM from the 17 month low experienced during the previous month but remained lower on a YOY basis for the fifth consecutive month, finishing down 4.9%. Beef stocks had increased YOY for 14 consecutive months prior to the five most recent YOY declines experienced from Feb ’16 – Jun ’16. Despite remaining lower on a YOY basis, Jun ’16 beef stocks remain 3.0% above three year average figures for the month of June.
Chicken – Stocks Reach a 14 Year High for the Month of June, Finish up 12.5% YOY
Jun ’16 U.S. frozen chicken stocks of 814.8 million pounds increased 1.0% MOM and 12.5% YOY, finishing at a 14 year high for the month of June. Chicken stocks have increased on a YOY basis for 19 months in a row after nine consecutive months of YOY declines were experienced from Mar ’14 – Nov ’14. Stocks have built as the Russian import ban continues to negatively affect U.S. broiler exports. U.S. broiler export volumes have declined by 9.4% YOY since the ban was announced. Jun ’16 chicken stocks finished 22.4% higher than three year average figures for the month of June.
Overall, combined Jun ’16 U.S. pork, beef and chicken stocks remained 5.9% below the monthly record high experienced in Oct ’15. Individually, Jun ’16 U.S. pork, beef and chicken stocks finished within 12-17% of historical maximum storage levels.
Jun ’16 combined U.S. pork, beef and chicken stocks finished at a record high seasonal storage level for the month of June. Pork and beef stocks each finished within 10% of historical maximum storage levels for the month of June while chicken stocks finished within 5% of historical June storage levels.