U.S. Milk Production Update – Jun ’16
Executive Summary
U.S. milk production figures provided by USDA were recently updated with values spanning through May ’16. Highlights from the updated report include:
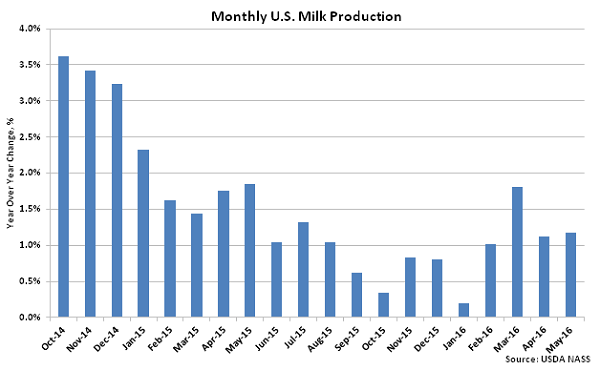
• U.S. milk production remained higher on a YOY basis for the 29th consecutive month during May ’16, finishing up 1.2%. The YOY growth rate was the second highest experienced in the past ten months on a percentage basis.
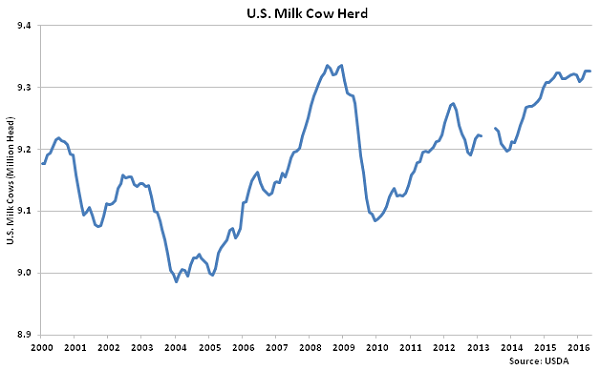
• The U.S. dairy cow herd remained flat for the second consecutive month throughout May ’16, finishing at the highest figure on record experienced since Dec ’08.
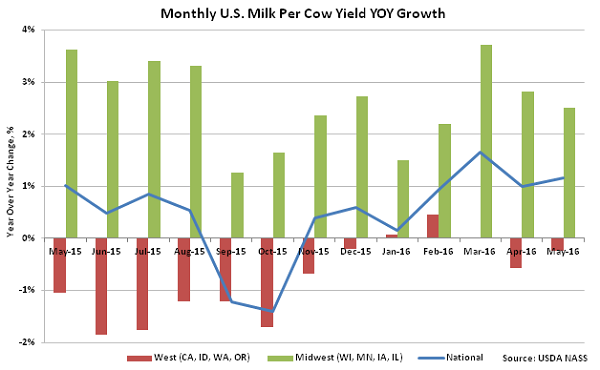
• U.S. milk per cow yields increased on a YOY basis for the seventh consecutive month during May ’16 as growth in Midwestern yields offset YOY declines in yields experienced throughout the Western United States.
Additional Report Details
According to USDA, May ’16 U.S. milk production was up 1.2% YOY, at 18.6 billion pounds, setting a new monthly production record. U.S. milk production has increased YOY for 29 consecutive months through May. Production also increased MOM, finishing 0.3% higher on a daily average basis. The MOM increase in production was slightly less than the ten year average April – May seasonal increase of 0.5%. U.S. milk production typically reaches peak levels during the month of May before declining until seasonal lows are reached in October.
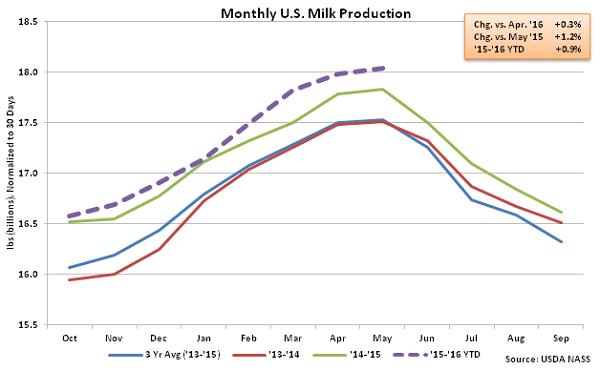 U.S. milk production remained significantly higher on a YOY basis throughout the final months of 2014, however production growth decelerated over the majority of 2015. The May ’16 YOY growth rate of 1.2% was the second highest experienced in the past ten months but remained below the ’14-’15 annual growth rate of 1.9%.
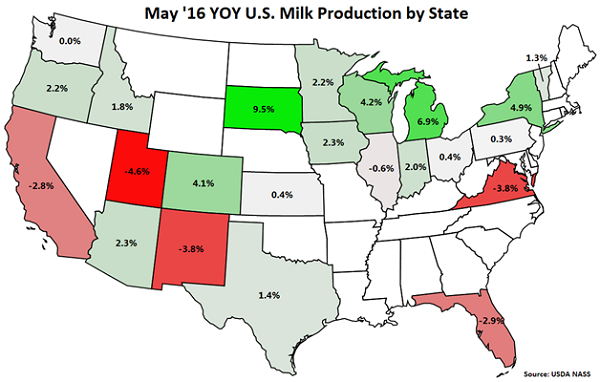
 YOY production gains on a percentage basis continue to be led by South Dakota (+9.5%), followed by Michigan (+6.9%), New York (+4.9%) and Wisconsin (+4.2%). California milk production declined YOY for the 17th consecutive month, finishing 2.8% lower, while production in Utah, New Mexico, Virginia, Florida, and Illinois also finished below the previous year. California, Utah, New Mexico, Virginia and Florida experienced both a reduction in their milk cow herds and lower YOY milk per cow yields during May ’16 while Illinois experienced a reduction in their milk cow herd.
 Overall, the U.S. milk cow herd remained flat for the second consecutive month during May ’16, as the Apr ’16 figure was revised 4,000 head lower. The U.S. milk cow herd remained at the highest figure on record experienced since Dec ’08. The total U.S. milk cow herd currently stands at 9,327,000 head, which is 3,000 head more than May of last year.
 The U.S. milk per cow yield increased YOY for the seventh consecutive month, finishing 1.2% higher than the previous year. Milk per cow yields continue to trend higher YOY in the Midwest, more than offsetting declining milk per cow yields in the Western United States. Milk per cow yields increased by an average of 2.5% YOY within Wisconsin, Minnesota, Iowa and Illinois while yields declined 0.2% YOY on average within California, Idaho, Washington and Oregon.
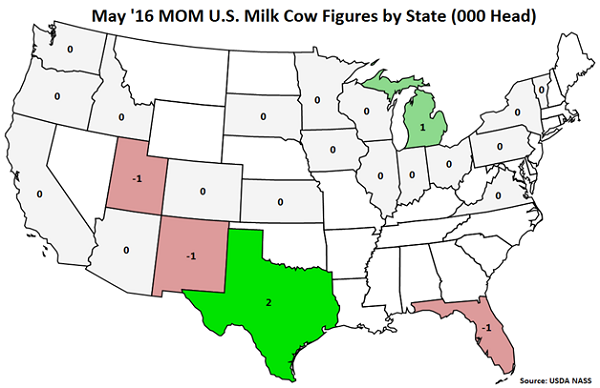
 MOM increases in the milk cow herd were experienced in Texas (+2,000 head) and Michigan (+1,000 head) while New Mexico, Utah and Florida each experienced MOM declines of 1,000 head during May ’16.
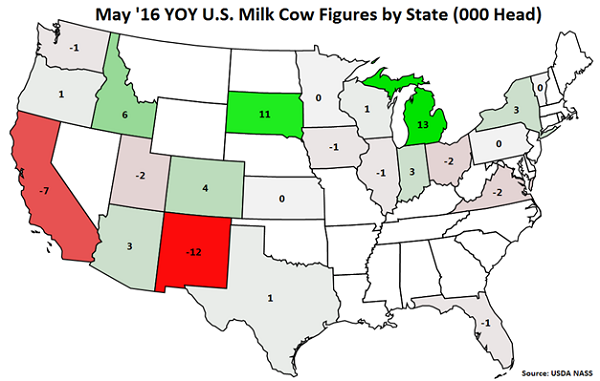
 YOY increases in milk cow herds continue to be led by Michigan (+13,000 head), followed by South Dakota (+11,000 head) and Idaho (+6,000 head). New Mexico (-12,000 head) and California (-7,000 head) experienced the largest YOY reductions in their milk cow herds throughout the month.
U.S. milk production remained significantly higher on a YOY basis throughout the final months of 2014, however production growth decelerated over the majority of 2015. The May ’16 YOY growth rate of 1.2% was the second highest experienced in the past ten months but remained below the ’14-’15 annual growth rate of 1.9%.
YOY production gains on a percentage basis continue to be led by South Dakota (+9.5%), followed by Michigan (+6.9%), New York (+4.9%) and Wisconsin (+4.2%). California milk production declined YOY for the 17th consecutive month, finishing 2.8% lower, while production in Utah, New Mexico, Virginia, Florida, and Illinois also finished below the previous year. California, Utah, New Mexico, Virginia and Florida experienced both a reduction in their milk cow herds and lower YOY milk per cow yields during May ’16 while Illinois experienced a reduction in their milk cow herd.
Overall, the U.S. milk cow herd remained flat for the second consecutive month during May ’16, as the Apr ’16 figure was revised 4,000 head lower. The U.S. milk cow herd remained at the highest figure on record experienced since Dec ’08. The total U.S. milk cow herd currently stands at 9,327,000 head, which is 3,000 head more than May of last year.
The U.S. milk per cow yield increased YOY for the seventh consecutive month, finishing 1.2% higher than the previous year. Milk per cow yields continue to trend higher YOY in the Midwest, more than offsetting declining milk per cow yields in the Western United States. Milk per cow yields increased by an average of 2.5% YOY within Wisconsin, Minnesota, Iowa and Illinois while yields declined 0.2% YOY on average within California, Idaho, Washington and Oregon.
MOM increases in the milk cow herd were experienced in Texas (+2,000 head) and Michigan (+1,000 head) while New Mexico, Utah and Florida each experienced MOM declines of 1,000 head during May ’16.
YOY increases in milk cow herds continue to be led by Michigan (+13,000 head), followed by South Dakota (+11,000 head) and Idaho (+6,000 head). New Mexico (-12,000 head) and California (-7,000 head) experienced the largest YOY reductions in their milk cow herds throughout the month.