Ethanol Rail Movements Update – Apr ’16
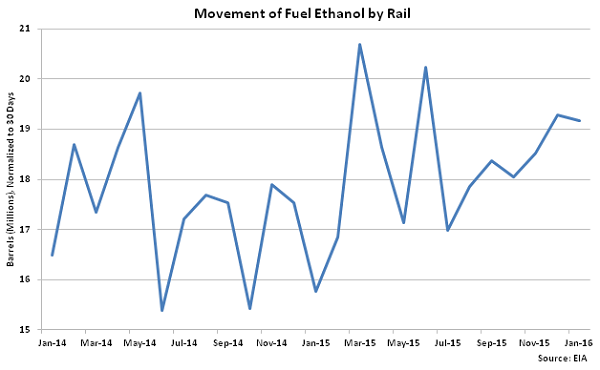
The EIA recently added reporting on ethanol rail movements, with figures dating back to Jan ’14. The most current monthly EIA report provided ethanol rail movement figures through Jan ’16. Jan ’16 ethanol rail movements of 19.8 million barrels declined 0.6% from Dec ’15 figures but remained 9.6% higher than the previous 24 month average ethanol rail movement figures.
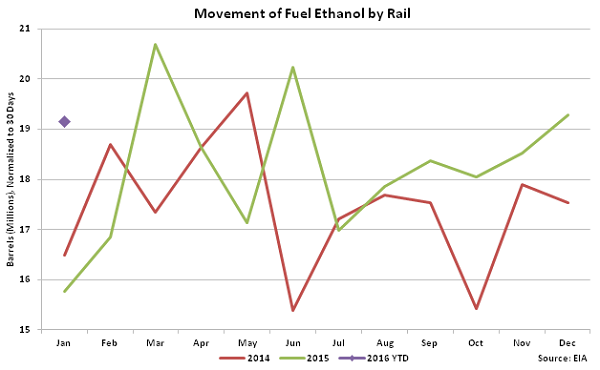
 Jan ’16 ethanol rail movements remained higher on a year-over-year (YOY) basis for the sixth consecutive month, finishing 21.5% above the previous year figures. Jan ’16 ethanol rail movements also finished 16.2% above figure the Jan ’14 figure.
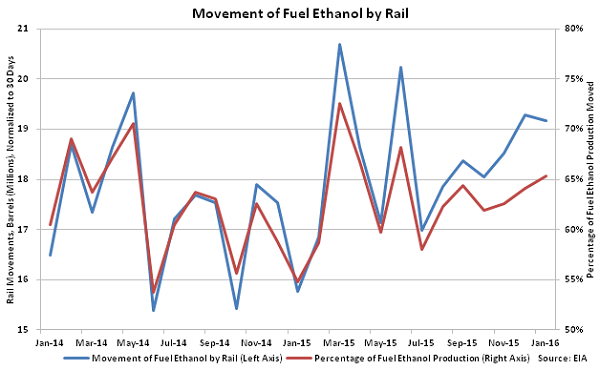
 Ethanol rail movements have ranged from 54% – 73% of monthly ethanol production over the 25 months of available data. Jan ’16 ethanol rail movements accounted for 65.3% of monthly production, which was slightly higher with the previous 24 month average of 62.6%.
 Ethanol rail movement figures are broken out by Petroleum Administration for Defense District (PADD) for both originating rail movements and destinations of shipments. The U.S. is regionally divided into five PADDs, which include the East Coast, Midwest, Gulf Coast, Rocky Mountain and West Coast.
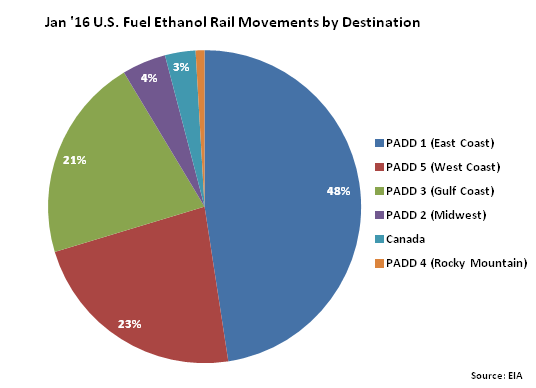
 Over 97% of rail movements originated in PADD 2 (Midwest) during Jan ’16, with the remaining three percent originating in PADD 3 (Gulf Coast). Nearly 9.5 million barrels of ethanol rail movements were destined to PADD 1 (East Coast) during Jan ’16, leading all regional districts.
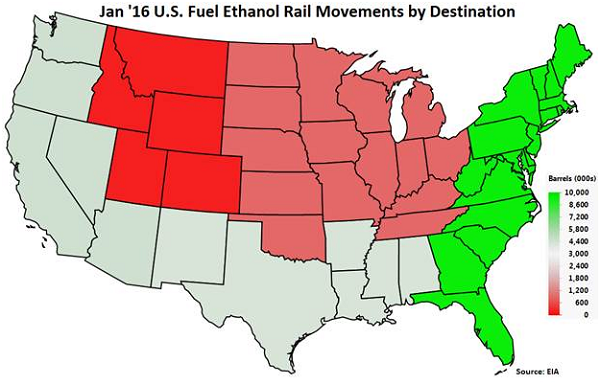 Ethanol rail movements destined to PADD 1 (East Coast) accounted for nearly half of the total shipments during Jan ’16. Combined shipments to PADD 1 (East Coast), PADD 5 (West Coast) and PADD 3 (Gulf Coast) consisted of over 90% of total ethanol rail movements, with minimal amounts being shipped to PADD 2 (Midwest), PADD 4 (Rocky Mountain) and Canada.
 Additional updates on the EIA ethanol rail movement figures will be provided on a quarterly basis going forward, with the next summary scheduled to be released in Jul ’16.
Jan ’16 ethanol rail movements remained higher on a year-over-year (YOY) basis for the sixth consecutive month, finishing 21.5% above the previous year figures. Jan ’16 ethanol rail movements also finished 16.2% above figure the Jan ’14 figure.
Ethanol rail movements have ranged from 54% – 73% of monthly ethanol production over the 25 months of available data. Jan ’16 ethanol rail movements accounted for 65.3% of monthly production, which was slightly higher with the previous 24 month average of 62.6%.
Ethanol rail movement figures are broken out by Petroleum Administration for Defense District (PADD) for both originating rail movements and destinations of shipments. The U.S. is regionally divided into five PADDs, which include the East Coast, Midwest, Gulf Coast, Rocky Mountain and West Coast.
Over 97% of rail movements originated in PADD 2 (Midwest) during Jan ’16, with the remaining three percent originating in PADD 3 (Gulf Coast). Nearly 9.5 million barrels of ethanol rail movements were destined to PADD 1 (East Coast) during Jan ’16, leading all regional districts.
Ethanol rail movements destined to PADD 1 (East Coast) accounted for nearly half of the total shipments during Jan ’16. Combined shipments to PADD 1 (East Coast), PADD 5 (West Coast) and PADD 3 (Gulf Coast) consisted of over 90% of total ethanol rail movements, with minimal amounts being shipped to PADD 2 (Midwest), PADD 4 (Rocky Mountain) and Canada.
Additional updates on the EIA ethanol rail movement figures will be provided on a quarterly basis going forward, with the next summary scheduled to be released in Jul ’16.