USDA Quarterly Hog and Pig Report Summary – Dec…
Pig Inventory – Inventory and Sows Kept for Breeding Remain up YOY
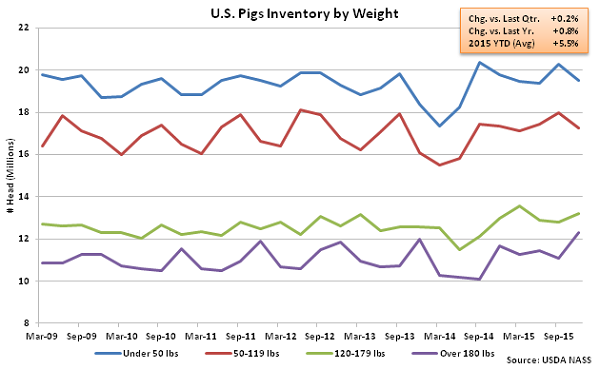
According to USDA, December 1st inventories of pigs increased by 0.8% YOY while also finishing 0.2% above Sep ’15 inventory levels. The YOY increase was the fifth experienced in a row while the 0.2% September – December increase was greater than the three year average September – December decline of 1.2%. On a YOY basis, weights 120 pounds or more increased 3.4% YOY while weights less than 120 pounds declined by 1.0% YOY.
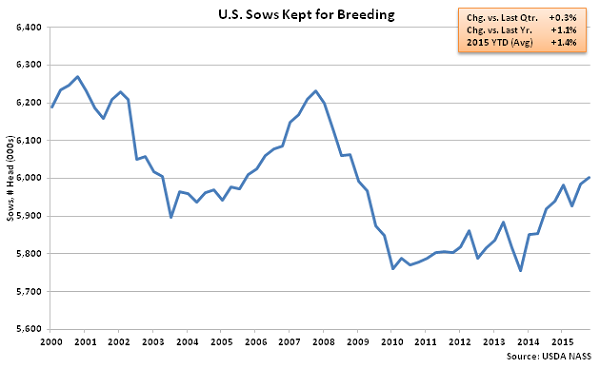
Dec ’15 sows kept for breeding increased by 1.1% YOY while also finishing 0.3% above the Sep ’15 inventory levels, setting a new seven year high. The recent increases in sows kept for breeding correlates with a period of very low sow cull/slaughter rates.
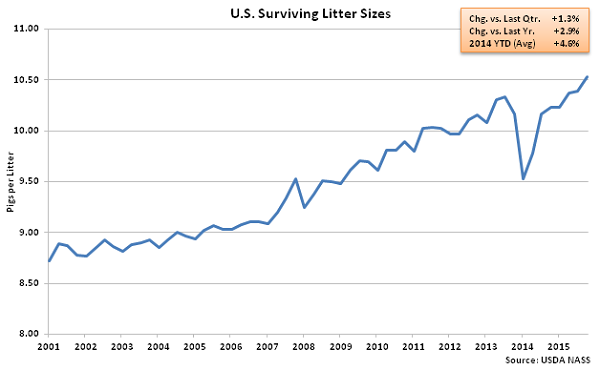
 Both litter and farrowing rates continued to rebound from the PED suppressed levels in prior quarters. Weaned pigs saved per litter increased to a record high 10.53 for the September – November period, finishing 2.9% higher than the previous year. Surviving litter sizes are up 4.6% YTD when compared to the previous year PED suppressed litter rates. Normally, litter sizes have historically only increased YOY due to improving genetics and production practices.
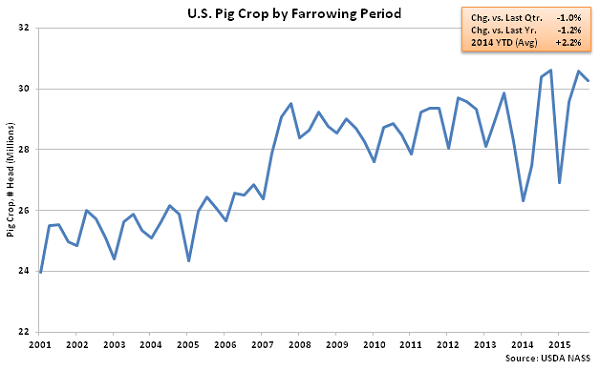
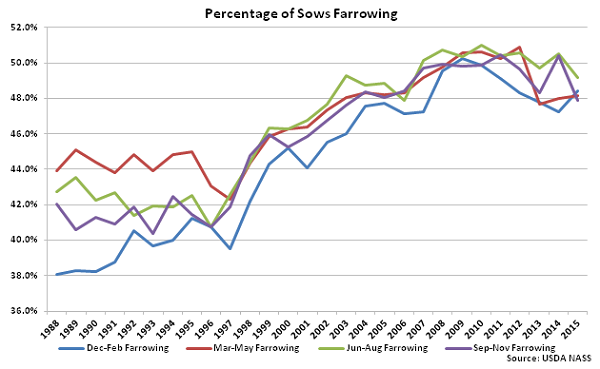
September – November farrowing rates declined 1.0% from the previous quarter and 1.2% from the previous year. Sows farrowing during the September – November period represented 47.9% of the breeding herd. Percentages of sows farrowing have trended lower of late, with the September – November figure down 3.1% vs. the three year average farrowing rates over the same period. Farrowing intentions were down 1.0% for both the Dec ’15 – Jan ’16 and the Mar ’16 – May ’16 periods.
Both litter and farrowing rates continued to rebound from the PED suppressed levels in prior quarters. Weaned pigs saved per litter increased to a record high 10.53 for the September – November period, finishing 2.9% higher than the previous year. Surviving litter sizes are up 4.6% YTD when compared to the previous year PED suppressed litter rates. Normally, litter sizes have historically only increased YOY due to improving genetics and production practices.
September – November farrowing rates declined 1.0% from the previous quarter and 1.2% from the previous year. Sows farrowing during the September – November period represented 47.9% of the breeding herd. Percentages of sows farrowing have trended lower of late, with the September – November figure down 3.1% vs. the three year average farrowing rates over the same period. Farrowing intentions were down 1.0% for both the Dec ’15 – Jan ’16 and the Mar ’16 – May ’16 periods.