U.S. Livestock & Meat Trade Update – Nov ’15
Pork – Net Trade Increases Sharply as Export Volumes Rise
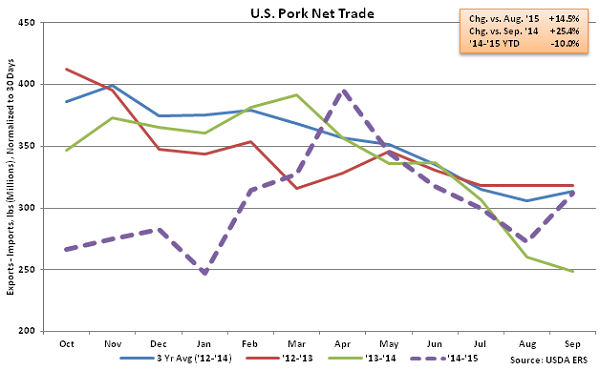
According to USDA, Sep ’15 U.S. pork export volumes increased 17.7% YOY and 11.5% MOM on a daily average basis. The YOY increase in pork exports was an 18 month high on a percentage basis. U.S. pork exports destined to Japan and Mexico remained strong, increasing by 25.3% and 8.6% YOY, respectively while exports destined to South Korea increased YOY for the 20th consecutive month, finishing slightly the previous year. Exports destined to Canada declined for the sixth consecutive month on a YOY basis, however, finishing 1.0% below the previous year. U.S. pork exports to Japan, Mexico, South Korea and Canada accounted for three quarters of all pork export volumes in Sep ’15.
Sep ’15 U.S. pork imports increased 2.6% MOM a daily average basis but finished 2.7% below the previous year. U.S. pork imports had increased YOY throughout 17 of the past 18 months prior to the most recent decline. Sep ’15 U.S. net pork trade increased 14.5% MOM on a daily average basis and 25.4% YOY, which was the largest YOY increase experienced in over three and a half years. Despite the YOY gain, ’14-’15 annual net pork trade finished down 10.0% to a new five year low.
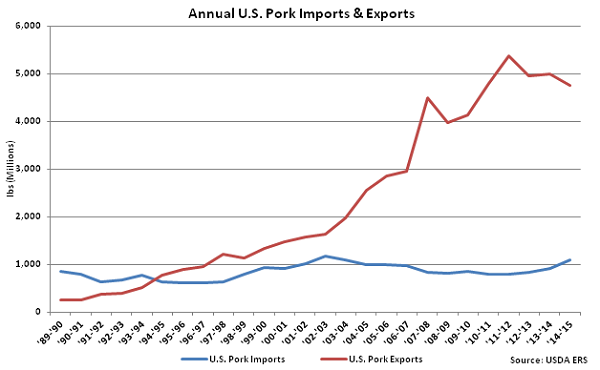
 U.S. pork export volumes have strengthened considerably over the past 25 years, increasing at a compound annual growth rate (CAGR) of 13.2%, while U.S. pork imports have remained fairly flat, increasing at a CAGR of 0.3% over the same time period. ’13-’14 annual pork imports experienced much stronger growth, finishing 10.5% higher than the previous year, the largest YOY percentage gain in 11 years. Despite the increase in pork imports, ’13-’14 annual pork exports volumes remained over five times as large as import volumes. Pork export volumes remained over four times as large as import volumes throughout the ’14-’15 production season despite declining to a five year low on an absolute basis.
 Beef & Veal – Net Trade Remains Down Significantly YOY
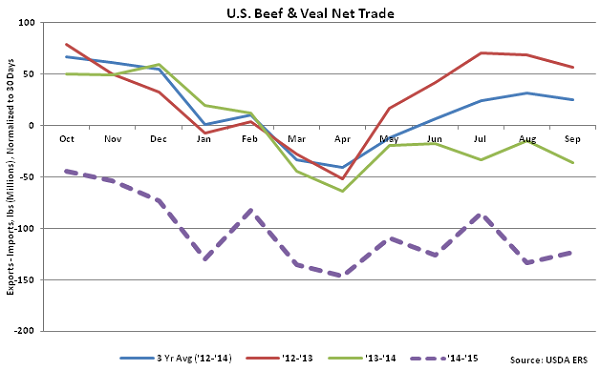
Sep ’15 U.S. beef & veal export volumes remained weak, declining 25.0% YOY and 3.0% MOM on a daily average basis. Beef & veal export volumes have declined YOY for 15 consecutive months through September. Of the major export destinations, YOY declines in export volumes were led by Japan (-36.0%), followed by combined volumes to Hong Kong, Taiwan and China (-34.9%), Mexico (-24.9%), Canada (-16.1%) and South Korea (-10.0%). Export volumes to South Korea had increased YOY for seven consecutive months prior to the most recent decline. U.S. beef & veal exports to the aforementioned countries accounted for over 85% of all beef & veal export volumes in Sep ’15.
Sep ’15 U.S. beef & veal imports continued to increase on a YOY basis, finishing up 12.8%, but declined 4.9% MOM on a daily average basis. Beef & veal import volumes have increased YOY for 19 consecutive months through Sep ’15, exceeding export volumes by 38.6% over the period.
Beef & Veal – Net Trade Remains Down Significantly YOY
Sep ’15 U.S. beef & veal export volumes remained weak, declining 25.0% YOY and 3.0% MOM on a daily average basis. Beef & veal export volumes have declined YOY for 15 consecutive months through September. Of the major export destinations, YOY declines in export volumes were led by Japan (-36.0%), followed by combined volumes to Hong Kong, Taiwan and China (-34.9%), Mexico (-24.9%), Canada (-16.1%) and South Korea (-10.0%). Export volumes to South Korea had increased YOY for seven consecutive months prior to the most recent decline. U.S. beef & veal exports to the aforementioned countries accounted for over 85% of all beef & veal export volumes in Sep ’15.
Sep ’15 U.S. beef & veal imports continued to increase on a YOY basis, finishing up 12.8%, but declined 4.9% MOM on a daily average basis. Beef & veal import volumes have increased YOY for 19 consecutive months through Sep ’15, exceeding export volumes by 38.6% over the period.
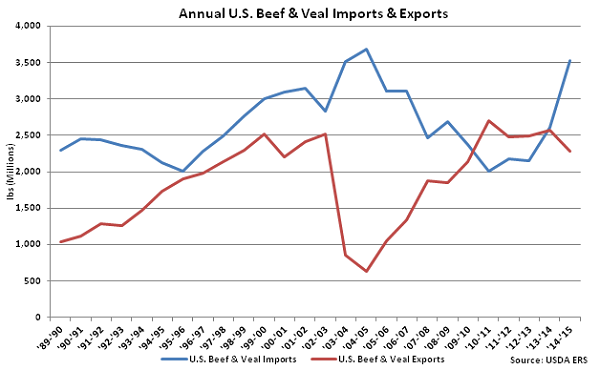
 Recent strength in beef & veal imports resulted in ’13-’14 annual U.S. beef & veal imports finishing higher than annual U.S. beef & veal exports for the first time in four years, with this trend continuing into the ’14-’15 production season. ’14-’15 annual beef & veal net trade declined to a new eight year low as imports increased to a ten year high.
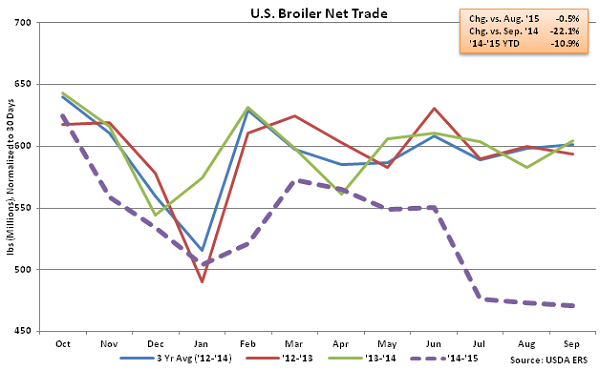
 Chicken – Net Trade Declines to New Four and a Half Year Low on Weak Export Demand
Sep ’15 U.S. broiler export volumes remained weak declining 21.7% YOY and 0.8% MOM on a daily average basis to a new four and a half year low. Monthly export volumes have declined YOY throughout 11 of the past 12 months as exports were negatively affected by the Russian import ban, however declines have also been experienced in other major U.S. broiler import markets. Combined broiler export volumes to Hong Kong, Taiwan and China finished down 12.5% YOY, while broiler export volumes to Mexico declined YOY for the fifth consecutive month, finishing down 9.4%. U.S. broiler export volumes destined to Mexico had increased YOY for 17 consecutive months from Dec ’13 – Apr ’15. Despite the recent declines, broiler export volumes to Mexico have accounted for over a fifth of total broiler export volumes over the past 12 months.
Sep ’15 U.S. broiler imports continued to increase on a YOY basis, finishing up 2.6%, but declined 13.1% MOM on a daily average basis. Broiler imports remain at insignificant levels relative to export volumes, with Sep ’15 imports amounting to only 2.0% of export volumes. Declining broiler exports, coupled with increasing imports, resulted in Sep ’15 net broiler trade declining YOY for the 11th time in the past 12 months, finishing down 22.1% and also reaching a new four and a half year low. Net broiler trade finished the ’14-’15 production season down 10.9% to a new five year low.
Chicken – Net Trade Declines to New Four and a Half Year Low on Weak Export Demand
Sep ’15 U.S. broiler export volumes remained weak declining 21.7% YOY and 0.8% MOM on a daily average basis to a new four and a half year low. Monthly export volumes have declined YOY throughout 11 of the past 12 months as exports were negatively affected by the Russian import ban, however declines have also been experienced in other major U.S. broiler import markets. Combined broiler export volumes to Hong Kong, Taiwan and China finished down 12.5% YOY, while broiler export volumes to Mexico declined YOY for the fifth consecutive month, finishing down 9.4%. U.S. broiler export volumes destined to Mexico had increased YOY for 17 consecutive months from Dec ’13 – Apr ’15. Despite the recent declines, broiler export volumes to Mexico have accounted for over a fifth of total broiler export volumes over the past 12 months.
Sep ’15 U.S. broiler imports continued to increase on a YOY basis, finishing up 2.6%, but declined 13.1% MOM on a daily average basis. Broiler imports remain at insignificant levels relative to export volumes, with Sep ’15 imports amounting to only 2.0% of export volumes. Declining broiler exports, coupled with increasing imports, resulted in Sep ’15 net broiler trade declining YOY for the 11th time in the past 12 months, finishing down 22.1% and also reaching a new four and a half year low. Net broiler trade finished the ’14-’15 production season down 10.9% to a new five year low.
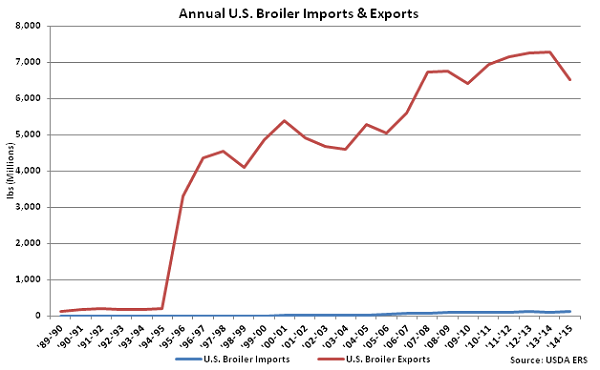
 U.S. broiler export volumes have strengthened considerably over the past 25 years, increasing at a compound annual growth rate (CAGR) of 18.3%. U.S. broiler import volumes have increased at a CAGR of 21.6% over the same time period but remain significantly lower. ’13-’14 annual broiler exports volumes were over 60 times as large as import volumes. Broiler export volumes remained 54 times as large as import volumes throughout the ’14-’15 production season despite declining to a five year low on an absolute basis.
U.S. pork export volumes have strengthened considerably over the past 25 years, increasing at a compound annual growth rate (CAGR) of 13.2%, while U.S. pork imports have remained fairly flat, increasing at a CAGR of 0.3% over the same time period. ’13-’14 annual pork imports experienced much stronger growth, finishing 10.5% higher than the previous year, the largest YOY percentage gain in 11 years. Despite the increase in pork imports, ’13-’14 annual pork exports volumes remained over five times as large as import volumes. Pork export volumes remained over four times as large as import volumes throughout the ’14-’15 production season despite declining to a five year low on an absolute basis.
Beef & Veal – Net Trade Remains Down Significantly YOY
Sep ’15 U.S. beef & veal export volumes remained weak, declining 25.0% YOY and 3.0% MOM on a daily average basis. Beef & veal export volumes have declined YOY for 15 consecutive months through September. Of the major export destinations, YOY declines in export volumes were led by Japan (-36.0%), followed by combined volumes to Hong Kong, Taiwan and China (-34.9%), Mexico (-24.9%), Canada (-16.1%) and South Korea (-10.0%). Export volumes to South Korea had increased YOY for seven consecutive months prior to the most recent decline. U.S. beef & veal exports to the aforementioned countries accounted for over 85% of all beef & veal export volumes in Sep ’15.
Sep ’15 U.S. beef & veal imports continued to increase on a YOY basis, finishing up 12.8%, but declined 4.9% MOM on a daily average basis. Beef & veal import volumes have increased YOY for 19 consecutive months through Sep ’15, exceeding export volumes by 38.6% over the period.
Recent strength in beef & veal imports resulted in ’13-’14 annual U.S. beef & veal imports finishing higher than annual U.S. beef & veal exports for the first time in four years, with this trend continuing into the ’14-’15 production season. ’14-’15 annual beef & veal net trade declined to a new eight year low as imports increased to a ten year high.
Chicken – Net Trade Declines to New Four and a Half Year Low on Weak Export Demand
Sep ’15 U.S. broiler export volumes remained weak declining 21.7% YOY and 0.8% MOM on a daily average basis to a new four and a half year low. Monthly export volumes have declined YOY throughout 11 of the past 12 months as exports were negatively affected by the Russian import ban, however declines have also been experienced in other major U.S. broiler import markets. Combined broiler export volumes to Hong Kong, Taiwan and China finished down 12.5% YOY, while broiler export volumes to Mexico declined YOY for the fifth consecutive month, finishing down 9.4%. U.S. broiler export volumes destined to Mexico had increased YOY for 17 consecutive months from Dec ’13 – Apr ’15. Despite the recent declines, broiler export volumes to Mexico have accounted for over a fifth of total broiler export volumes over the past 12 months.
Sep ’15 U.S. broiler imports continued to increase on a YOY basis, finishing up 2.6%, but declined 13.1% MOM on a daily average basis. Broiler imports remain at insignificant levels relative to export volumes, with Sep ’15 imports amounting to only 2.0% of export volumes. Declining broiler exports, coupled with increasing imports, resulted in Sep ’15 net broiler trade declining YOY for the 11th time in the past 12 months, finishing down 22.1% and also reaching a new four and a half year low. Net broiler trade finished the ’14-’15 production season down 10.9% to a new five year low.
U.S. broiler export volumes have strengthened considerably over the past 25 years, increasing at a compound annual growth rate (CAGR) of 18.3%. U.S. broiler import volumes have increased at a CAGR of 21.6% over the same time period but remain significantly lower. ’13-’14 annual broiler exports volumes were over 60 times as large as import volumes. Broiler export volumes remained 54 times as large as import volumes throughout the ’14-’15 production season despite declining to a five year low on an absolute basis.