U.S. Dairy Product Production Update – Nov ’15
Butter – Production Rebounds off of Four and a Half Year Low, Finishes up 0.9% YOY
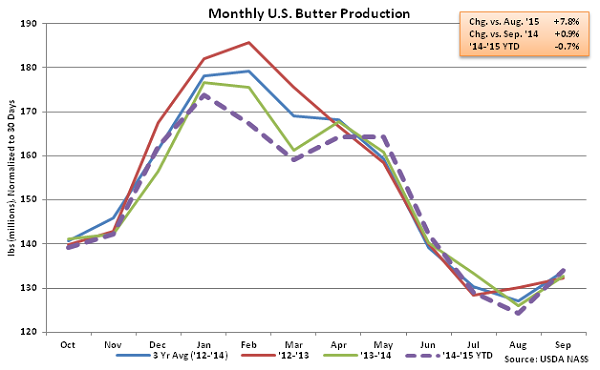
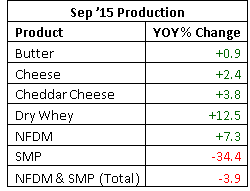
According to USDA, Sep ’15 U.S. butter production of 134.0 million pounds increased 7.8% MOM on a daily average basis from the four and a half year low experienced in Aug ’15 while also finishing 0.9% above the previous year. The seasonal MOM increase of 7.8% was fairly consistent with the ten year average Aug – Sep increase in butter production of 8.1%. Butter production declined 9.2% YOY in the Atlantic U.S. and 1.0% YOY in the Central U.S. but increased by 4.4% YOY in the Western U.S despite declines in California production. California butter production declined 6.8% YOY however other Western states increased production by 23.0% YOY throughout the month. Despite the YOY increase, ’14-’15 annual butter production finished down 0.7% YOY to a four year low.
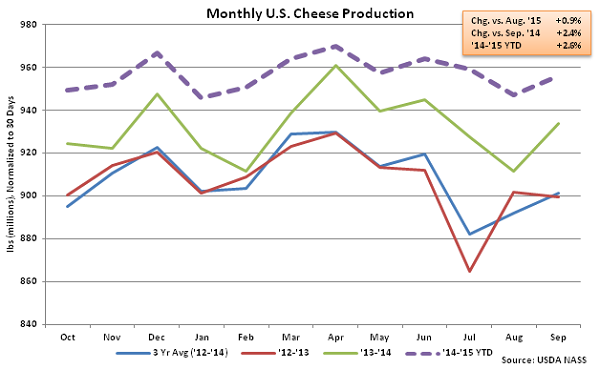
 Cheese – Production Increases 2.4% YOY, Reaches New Record High for the Month of Sep
Sep ’15 total cheese production of 956.0 million pounds increased YOY for the 30th consecutive month, finishing 2.4% higher than the previous year and reaching a new record high for the month of September. Cheddar cheese production of 267.5 million pounds finished up 3.8% YOY while other-than-Cheddar cheese production of 688.4 million pounds increased 1.8% YOY. ’14-’15 annual total cheese production finished up 2.6% YOY while cheddar cheese production finished up 2.7%. The 2.6% increase in annual total cheese production was consistent with the ten year average annual growth rate.
Cheese – Production Increases 2.4% YOY, Reaches New Record High for the Month of Sep
Sep ’15 total cheese production of 956.0 million pounds increased YOY for the 30th consecutive month, finishing 2.4% higher than the previous year and reaching a new record high for the month of September. Cheddar cheese production of 267.5 million pounds finished up 3.8% YOY while other-than-Cheddar cheese production of 688.4 million pounds increased 1.8% YOY. ’14-’15 annual total cheese production finished up 2.6% YOY while cheddar cheese production finished up 2.7%. The 2.6% increase in annual total cheese production was consistent with the ten year average annual growth rate.
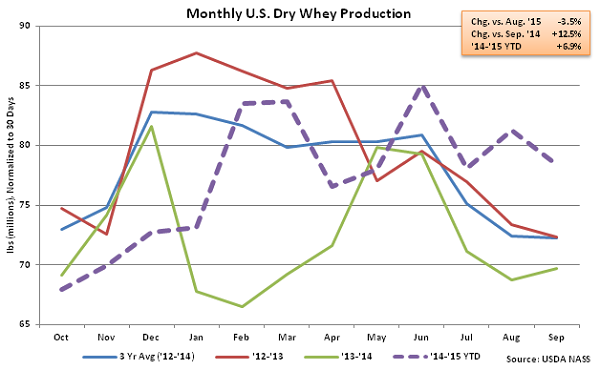
 Dry Whey – Production Finishes Higher YOY for Eighth Time in Past Nine Months
Consistent with the continued growth in cheese production, Sep ’15 U.S. dry whey production increased YOY for the eighth time in the past nine months. Dry whey production of 78.4 million pounds finished 12.5% above the previous year, although production did decline 3.5% MOM on a daily average basis. Combined whey protein concentrate (WPC) and whey protein isolate (WPI) production remained lower on a YOY basis, declining by 4.8% YOY. Combined WPC and WPI production increased by 18.3% YOY throughout the ’13-’14 production season but dropped below last year’s levels throughout the’14-’15 production season, finishing down 3.1% YOY. ’14-’15 annual dry whey production finished up 6.9% YOY, with total combined dry whey, WPC and WPI production finishing up 2.7% YOY.
Dry Whey – Production Finishes Higher YOY for Eighth Time in Past Nine Months
Consistent with the continued growth in cheese production, Sep ’15 U.S. dry whey production increased YOY for the eighth time in the past nine months. Dry whey production of 78.4 million pounds finished 12.5% above the previous year, although production did decline 3.5% MOM on a daily average basis. Combined whey protein concentrate (WPC) and whey protein isolate (WPI) production remained lower on a YOY basis, declining by 4.8% YOY. Combined WPC and WPI production increased by 18.3% YOY throughout the ’13-’14 production season but dropped below last year’s levels throughout the’14-’15 production season, finishing down 3.1% YOY. ’14-’15 annual dry whey production finished up 6.9% YOY, with total combined dry whey, WPC and WPI production finishing up 2.7% YOY.
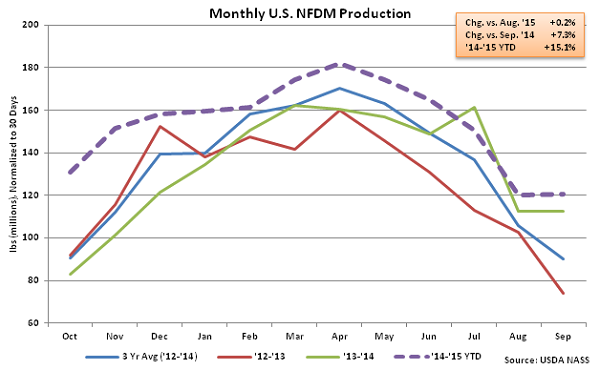
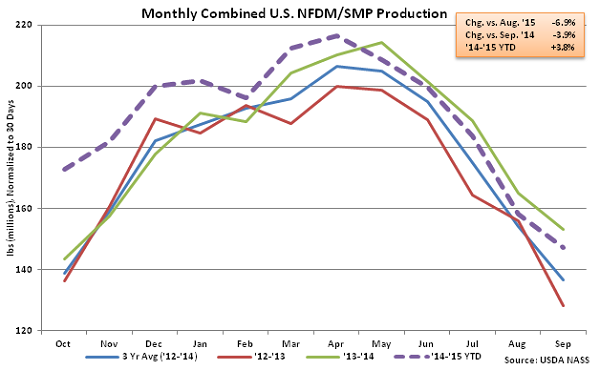
 NFDM/SMP – Combined Production Declines YOY for Fifth Consecutive Month
Sep ’15 U.S. NFDM production of 120.5 million pounds increased YOY for the 19th time in the past 20 months, finishing 7.3% above the previous year. SMP, which is more suited to the requirements of most global markets, decreased YOY for the 15th time in the past 16 months, with production of 26.8 million pounds declining by 34.4% YOY. Overall, Sep ’15 combined production of NFDM and SMP declined YOY for the fifth consecutive month, falling 3.9% YOY. The past five YOY declines in combined production were for the first experienced in the past 19 months. Despite the recently experienced declines, ’14-’15 annual combined U.S. NFDM and SMP production finished up 3.8%.
NFDM/SMP – Combined Production Declines YOY for Fifth Consecutive Month
Sep ’15 U.S. NFDM production of 120.5 million pounds increased YOY for the 19th time in the past 20 months, finishing 7.3% above the previous year. SMP, which is more suited to the requirements of most global markets, decreased YOY for the 15th time in the past 16 months, with production of 26.8 million pounds declining by 34.4% YOY. Overall, Sep ’15 combined production of NFDM and SMP declined YOY for the fifth consecutive month, falling 3.9% YOY. The past five YOY declines in combined production were for the first experienced in the past 19 months. Despite the recently experienced declines, ’14-’15 annual combined U.S. NFDM and SMP production finished up 3.8%.
 See the table below for a summary of key U.S. dairy product production in Sep ’15.
Cheese – Production Increases 2.4% YOY, Reaches New Record High for the Month of Sep
Sep ’15 total cheese production of 956.0 million pounds increased YOY for the 30th consecutive month, finishing 2.4% higher than the previous year and reaching a new record high for the month of September. Cheddar cheese production of 267.5 million pounds finished up 3.8% YOY while other-than-Cheddar cheese production of 688.4 million pounds increased 1.8% YOY. ’14-’15 annual total cheese production finished up 2.6% YOY while cheddar cheese production finished up 2.7%. The 2.6% increase in annual total cheese production was consistent with the ten year average annual growth rate.
Dry Whey – Production Finishes Higher YOY for Eighth Time in Past Nine Months
Consistent with the continued growth in cheese production, Sep ’15 U.S. dry whey production increased YOY for the eighth time in the past nine months. Dry whey production of 78.4 million pounds finished 12.5% above the previous year, although production did decline 3.5% MOM on a daily average basis. Combined whey protein concentrate (WPC) and whey protein isolate (WPI) production remained lower on a YOY basis, declining by 4.8% YOY. Combined WPC and WPI production increased by 18.3% YOY throughout the ’13-’14 production season but dropped below last year’s levels throughout the’14-’15 production season, finishing down 3.1% YOY. ’14-’15 annual dry whey production finished up 6.9% YOY, with total combined dry whey, WPC and WPI production finishing up 2.7% YOY.
NFDM/SMP – Combined Production Declines YOY for Fifth Consecutive Month
Sep ’15 U.S. NFDM production of 120.5 million pounds increased YOY for the 19th time in the past 20 months, finishing 7.3% above the previous year. SMP, which is more suited to the requirements of most global markets, decreased YOY for the 15th time in the past 16 months, with production of 26.8 million pounds declining by 34.4% YOY. Overall, Sep ’15 combined production of NFDM and SMP declined YOY for the fifth consecutive month, falling 3.9% YOY. The past five YOY declines in combined production were for the first experienced in the past 19 months. Despite the recently experienced declines, ’14-’15 annual combined U.S. NFDM and SMP production finished up 3.8%.
See the table below for a summary of key U.S. dairy product production in Sep ’15.