U.S. Milk Production Update – Sep ’15
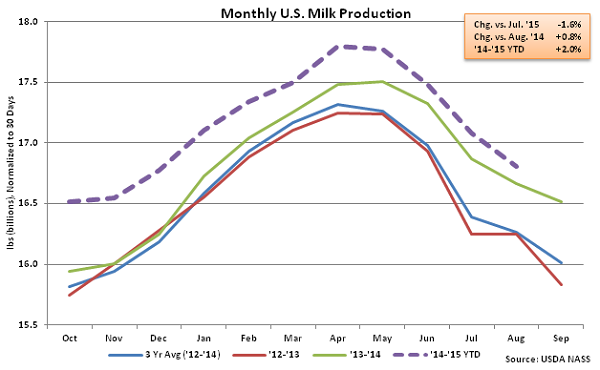
According to USDA, Aug ’15 U.S. milk production was up 0.8% YOY, at 17,366 million pounds, setting a new August production record. Production continued to decline MOM, however, contracting 1.6% on a daily average basis as production continues to seasonally decline until lows are typically reached in October. Production has declined seasonally from July – August by an average rate of 1.0% over the past ten years.
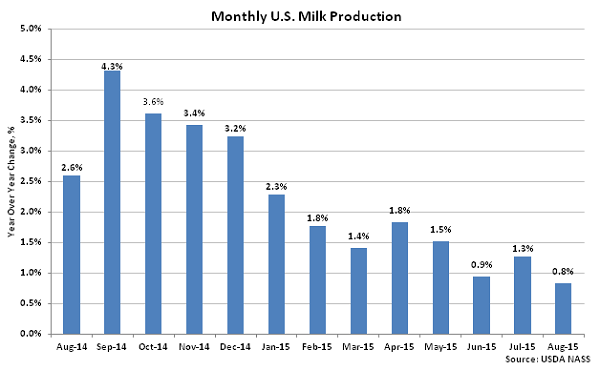
 U.S. milk production remained significantly higher on a YOY basis throughout the second half of 2014, as shown below, however production growth decelerated over the final quarter of the year and into 2015. The Aug ’15 YOY growth rate of 0.8% was a 20 month low and significantly below the ’14-’15 YTD growth rate of 2.0%.
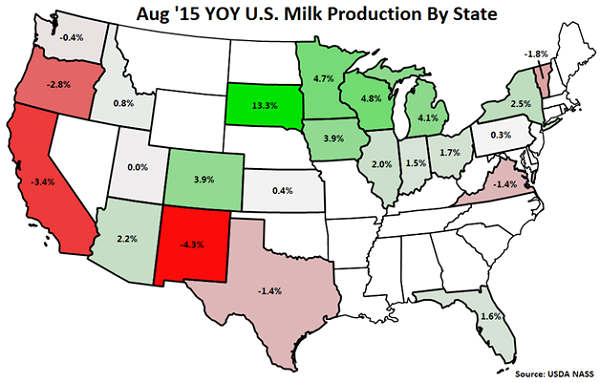
 YOY production gains on a percentage basis continue to be led by South Dakota (+13.3%), followed by Wisconsin (+4.8%) and Minnesota (+4.7%). California milk production declined YOY for the ninth consecutive month, finishing 3.4% lower, while production in New Mexico, Oregon, Vermont, Texas and Virginia also finished lower than the prior year. California, New Mexico, Oregon and Vermont experienced lower YOY milk per cow yields while California, Oregon, Texas and Virginia experienced reductions in their milk cow herds.
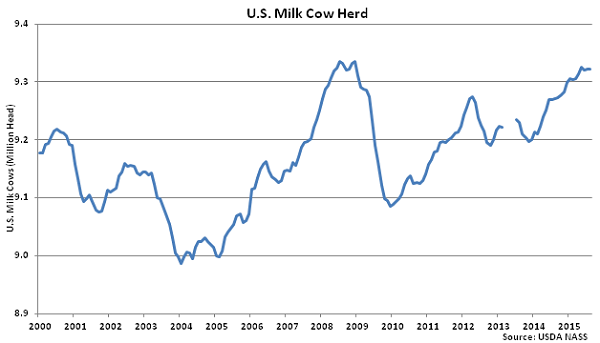
 Overall, the U.S. milk cow herd remained unchanged MOM for the second consecutive month in Aug ’15. The total U.S. milk cow herd currently stands at 9,321,000 head, which is 53,000 head more than August of last year.
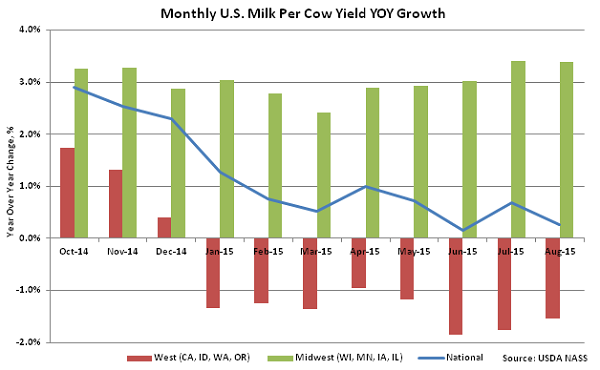
 The U.S. milk per cow yield was up 0.3% YOY, increasing to 1,863 lbs, the largest on record for the month of August. Milk per cow yields continue to trend higher YOY in the Midwest while declining in the Western U.S. Milk per cow yields increased by an average of 3.4% YOY within Wisconsin, Minnesota, Iowa and Illinois while yields declined 1.5% YOY on average within California, Idaho, Washington and Oregon.
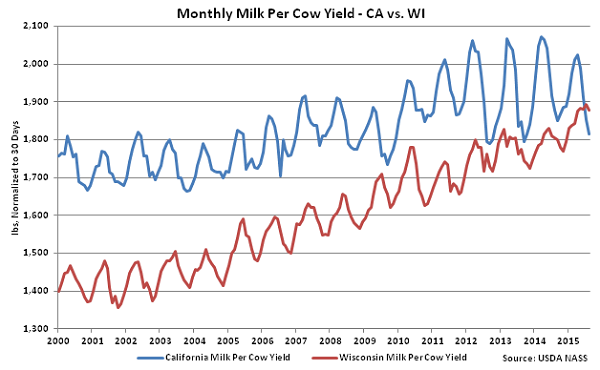
 Wisconsin milk per cow yields increased to a 63 year high relative to California milk per cow yields during Aug ’15, finishing higher than California yields on an absolute basis for the second consecutive month.
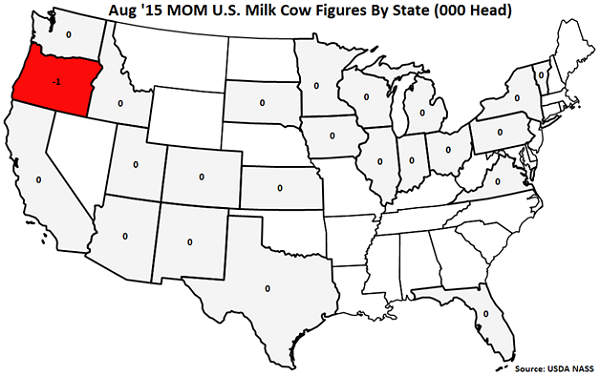
 Milk cow herds declined MOM in Oregon (-1,000 head) while no MOM increases in milk cow herds were exhibited.
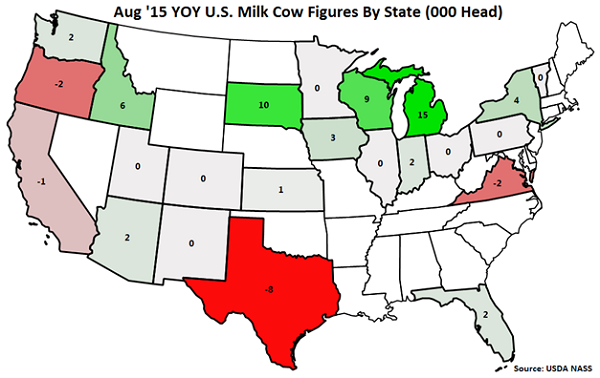
 YOY increases in milk cow herds continue to be led by Michigan (+15,000 head), followed by South Dakota (+10,000 head), Wisconsin (+9,000 head) and Idaho (+6,000 head). Texas (-8,000 head), Oregon (-2,000 head), Virginia (-2,000 head) and California (-1,000 head) experienced YOY reductions in their milk cow herds.
U.S. milk production remained significantly higher on a YOY basis throughout the second half of 2014, as shown below, however production growth decelerated over the final quarter of the year and into 2015. The Aug ’15 YOY growth rate of 0.8% was a 20 month low and significantly below the ’14-’15 YTD growth rate of 2.0%.
YOY production gains on a percentage basis continue to be led by South Dakota (+13.3%), followed by Wisconsin (+4.8%) and Minnesota (+4.7%). California milk production declined YOY for the ninth consecutive month, finishing 3.4% lower, while production in New Mexico, Oregon, Vermont, Texas and Virginia also finished lower than the prior year. California, New Mexico, Oregon and Vermont experienced lower YOY milk per cow yields while California, Oregon, Texas and Virginia experienced reductions in their milk cow herds.
Overall, the U.S. milk cow herd remained unchanged MOM for the second consecutive month in Aug ’15. The total U.S. milk cow herd currently stands at 9,321,000 head, which is 53,000 head more than August of last year.
The U.S. milk per cow yield was up 0.3% YOY, increasing to 1,863 lbs, the largest on record for the month of August. Milk per cow yields continue to trend higher YOY in the Midwest while declining in the Western U.S. Milk per cow yields increased by an average of 3.4% YOY within Wisconsin, Minnesota, Iowa and Illinois while yields declined 1.5% YOY on average within California, Idaho, Washington and Oregon.
Wisconsin milk per cow yields increased to a 63 year high relative to California milk per cow yields during Aug ’15, finishing higher than California yields on an absolute basis for the second consecutive month.
Milk cow herds declined MOM in Oregon (-1,000 head) while no MOM increases in milk cow herds were exhibited.
YOY increases in milk cow herds continue to be led by Michigan (+15,000 head), followed by South Dakota (+10,000 head), Wisconsin (+9,000 head) and Idaho (+6,000 head). Texas (-8,000 head), Oregon (-2,000 head), Virginia (-2,000 head) and California (-1,000 head) experienced YOY reductions in their milk cow herds.