Atten Babler Dairy FX Indices – Jun ’15
The Atten Babler Commodities Dairy Foreign Exchange (FX) Indices remained near record high levels during May ’15. The USD/Dairy Exporter FX Index increased to a new 13 year high while the USD/Domestic Dairy Importer Index increased slightly to the second highest figure on record. The USD/Dairy Importer FX Index fell for the third consecutive month but remains at the sixth highest figure on record.
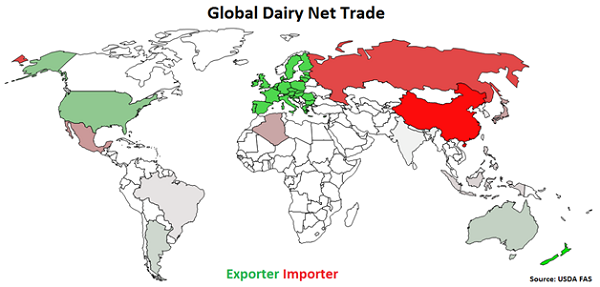
Global Dairy Net Trade:
Major net dairy exporters are led by New Zealand, followed by the EU-28, the U.S., Australia and Argentina (represented in green in the chart below). Major net dairy importers are led by China, followed by Russia, Mexico, Japan and Indonesia (represented in red in the chart below).
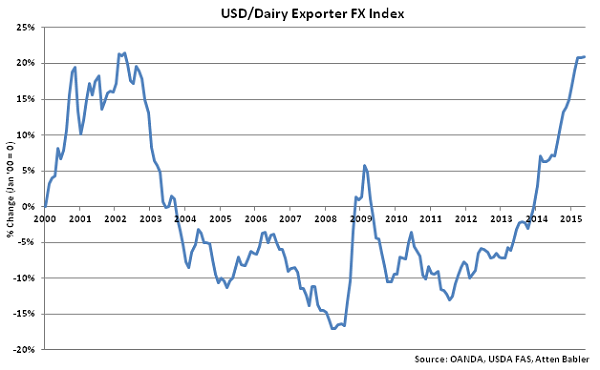
 USD/Dairy Exporter FX Index:
The USD/Dairy Exporter FX Index increased 0.2 points in May ’15 to a value of 120.9, a 13 year high. The USD/Dairy Exporter FX Index has increased 21.0 points since the beginning of 2014 and 7.1 points throughout the past six months. A strengthening USD/Dairy Exporter FX Index reduces the competitiveness of U.S. dairy products relative to other exporting regions (represented in green in the Global Dairy Net Trade chart), ultimately resulting in less foreign demand for U.S. products, all other factors being equal. USD appreciation against the Argentine peso has accounted for the majority of the gains since the beginning of 2014.
USD/Dairy Exporter FX Index:
The USD/Dairy Exporter FX Index increased 0.2 points in May ’15 to a value of 120.9, a 13 year high. The USD/Dairy Exporter FX Index has increased 21.0 points since the beginning of 2014 and 7.1 points throughout the past six months. A strengthening USD/Dairy Exporter FX Index reduces the competitiveness of U.S. dairy products relative to other exporting regions (represented in green in the Global Dairy Net Trade chart), ultimately resulting in less foreign demand for U.S. products, all other factors being equal. USD appreciation against the Argentine peso has accounted for the majority of the gains since the beginning of 2014.
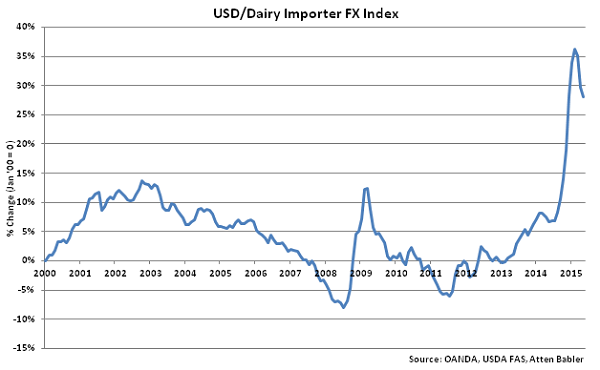
 USD/Dairy Importer FX Index:
The USD/Dairy Importer FX Index declined 1.6 points in May ’15 to a value of 128.1 as the Russian ruble continues to strengthen against the USD. The USD/Dairy Importer FX Index remains at the sixth highest figure on record and has increased 21.8 points since the beginning of 2014 and 9.2 points throughout the past six months. A strengthening USD/Dairy Importer FX Index results in less purchasing power for major dairy importing countries (represented in red in the Global Dairy Net Trade chart), making U.S. dairy products more expensive to import. USD appreciation against the Russian ruble has accounted for the majority of the gains since the beginning of 2014, despite the Russian ruble strengthening against the USD over the past three months.
USD/Dairy Importer FX Index:
The USD/Dairy Importer FX Index declined 1.6 points in May ’15 to a value of 128.1 as the Russian ruble continues to strengthen against the USD. The USD/Dairy Importer FX Index remains at the sixth highest figure on record and has increased 21.8 points since the beginning of 2014 and 9.2 points throughout the past six months. A strengthening USD/Dairy Importer FX Index results in less purchasing power for major dairy importing countries (represented in red in the Global Dairy Net Trade chart), making U.S. dairy products more expensive to import. USD appreciation against the Russian ruble has accounted for the majority of the gains since the beginning of 2014, despite the Russian ruble strengthening against the USD over the past three months.
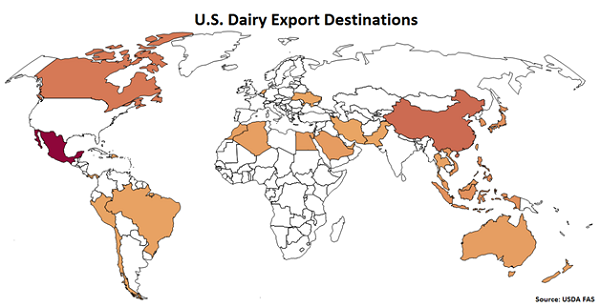
 U.S. Dairy Export Destinations:
Major destinations for U.S. dairy exports are led by Mexico, followed by China, Canada, the Philippines and Indonesia.
U.S. Dairy Export Destinations:
Major destinations for U.S. dairy exports are led by Mexico, followed by China, Canada, the Philippines and Indonesia.
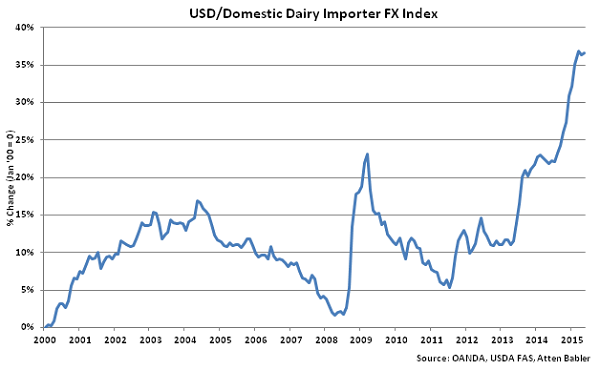
 USD/Domestic Dairy Importer FX Index:
The USD/Domestic Dairy Importer FX Index increased 0.3 points in May ’15 to a value of 136.6, the second highest figure on record. The USD/Domestic Dairy Importer FX Index has increased 14.9 points since the beginning of 2014 and 9.3 points throughout the past six months. A strengthening USD/Domestic Dairy Importer FX Index results in less purchasing power for the traditional buyers of U.S. dairy products (represented in red in the U.S. Dairy Export Destinations chart), ultimately resulting in less foreign demand for U.S. products, all other factors being equal. USD appreciation against the Mexican peso, Iranian rial and Ukrainian hryvnia has accounted for the majority of the gains since the beginning of 2014.
USD/Domestic Dairy Importer FX Index:
The USD/Domestic Dairy Importer FX Index increased 0.3 points in May ’15 to a value of 136.6, the second highest figure on record. The USD/Domestic Dairy Importer FX Index has increased 14.9 points since the beginning of 2014 and 9.3 points throughout the past six months. A strengthening USD/Domestic Dairy Importer FX Index results in less purchasing power for the traditional buyers of U.S. dairy products (represented in red in the U.S. Dairy Export Destinations chart), ultimately resulting in less foreign demand for U.S. products, all other factors being equal. USD appreciation against the Mexican peso, Iranian rial and Ukrainian hryvnia has accounted for the majority of the gains since the beginning of 2014.
USD/Dairy Exporter FX Index:
The USD/Dairy Exporter FX Index increased 0.2 points in May ’15 to a value of 120.9, a 13 year high. The USD/Dairy Exporter FX Index has increased 21.0 points since the beginning of 2014 and 7.1 points throughout the past six months. A strengthening USD/Dairy Exporter FX Index reduces the competitiveness of U.S. dairy products relative to other exporting regions (represented in green in the Global Dairy Net Trade chart), ultimately resulting in less foreign demand for U.S. products, all other factors being equal. USD appreciation against the Argentine peso has accounted for the majority of the gains since the beginning of 2014.
USD/Dairy Importer FX Index:
The USD/Dairy Importer FX Index declined 1.6 points in May ’15 to a value of 128.1 as the Russian ruble continues to strengthen against the USD. The USD/Dairy Importer FX Index remains at the sixth highest figure on record and has increased 21.8 points since the beginning of 2014 and 9.2 points throughout the past six months. A strengthening USD/Dairy Importer FX Index results in less purchasing power for major dairy importing countries (represented in red in the Global Dairy Net Trade chart), making U.S. dairy products more expensive to import. USD appreciation against the Russian ruble has accounted for the majority of the gains since the beginning of 2014, despite the Russian ruble strengthening against the USD over the past three months.
U.S. Dairy Export Destinations:
Major destinations for U.S. dairy exports are led by Mexico, followed by China, Canada, the Philippines and Indonesia.
USD/Domestic Dairy Importer FX Index:
The USD/Domestic Dairy Importer FX Index increased 0.3 points in May ’15 to a value of 136.6, the second highest figure on record. The USD/Domestic Dairy Importer FX Index has increased 14.9 points since the beginning of 2014 and 9.3 points throughout the past six months. A strengthening USD/Domestic Dairy Importer FX Index results in less purchasing power for the traditional buyers of U.S. dairy products (represented in red in the U.S. Dairy Export Destinations chart), ultimately resulting in less foreign demand for U.S. products, all other factors being equal. USD appreciation against the Mexican peso, Iranian rial and Ukrainian hryvnia has accounted for the majority of the gains since the beginning of 2014.