U.S. Dairy Products Production Update – Jun ’15
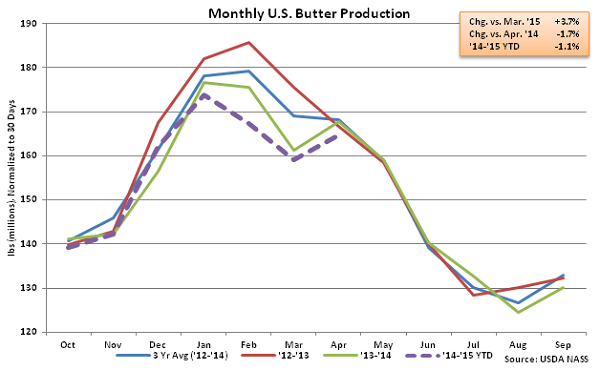
Butter – YOY Production Declines 1.7% YOY, Reaches Four Year Low for the Month of April
According to USDA, Apr ’15 U.S. butter production of 164.8 million pounds increased 3.7% MOM on a daily average basis but remained lower YOY, finished 1.7% below last year’s production level. Butter production for the month of April declined to a four year low, with Apr ’15 production falling 1.9% below the previous three year average April production. Butter produced in the Western region of the United States was down most significantly YOY, finishing 3.3% lower. ’14-’15 YTD butter production is down 1.1% through the first seven months of the production season.
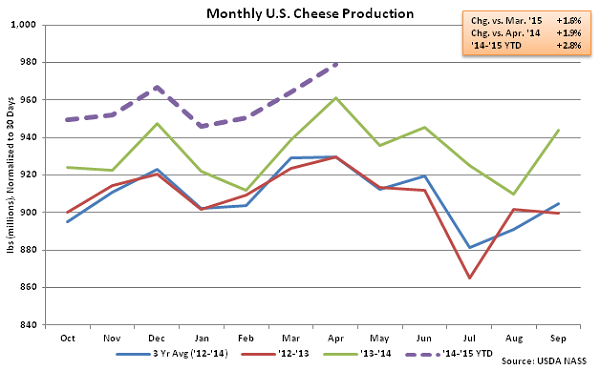
 Cheese – Production Sets New Monthly Record High
Apr ’15 total cheese production of 979.1 million pounds increased YOY for the 25th consecutive month, finishing 1.9% higher than last year. Total cheese production also increased 1.6% MOM on a daily average basis, finishing at the highest monthly figure on record. Record cheese production was achieved despite cheddar cheese production of 280.5 million pounds finishing 1.8% below the prior year. ’14-’15 YTD cheese production is up 2.8% YOY through the first seven months of the production season with cheddar cheese production up 2.1% over the same period. The 2.8% increase in annual cheese production would be a five year high.
Cheese – Production Sets New Monthly Record High
Apr ’15 total cheese production of 979.1 million pounds increased YOY for the 25th consecutive month, finishing 1.9% higher than last year. Total cheese production also increased 1.6% MOM on a daily average basis, finishing at the highest monthly figure on record. Record cheese production was achieved despite cheddar cheese production of 280.5 million pounds finishing 1.8% below the prior year. ’14-’15 YTD cheese production is up 2.8% YOY through the first seven months of the production season with cheddar cheese production up 2.1% over the same period. The 2.8% increase in annual cheese production would be a five year high.
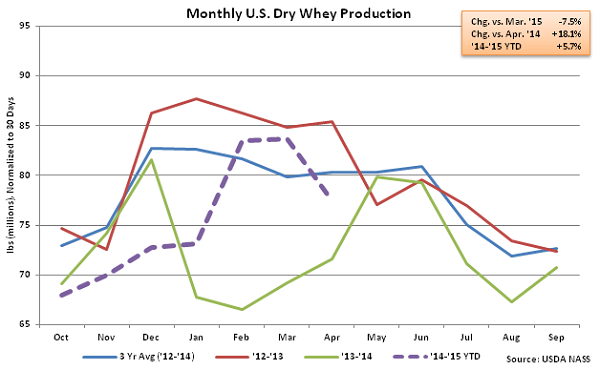
 Dry Whey – Production Remains Significantly Higher YOY
Apr ’15 U.S. dry whey production of 77.4 million pounds declined 7.5% MOM on a daily average basis but remained significantly higher YOY, increased by 18.1% as manufacturers continue to shift away from higher-value whey protein products. The YOY increase in whey protein production was the third largest experienced in the past 12 years on a percentage basis, trailing only the Jan ’15 and Feb ’15 increases. Combined whey protein concentrates (WPC) and whey protein isolates (WPI) production remained lower on a YOY basis, declining by 5.4% YOY. Combined WPC and WPI production increased by 18.3% YOY throughout the ’13-’14 production season but has dropped below last year’s levels throughout the first seven months of the ’14-’15 production season, down 2.3% YTD. ’14-’15 YTD dry whey production is up 5.7% YOY, with total combined dry whey, WPC and WPI production up 2.2% YOY through April.
Dry Whey – Production Remains Significantly Higher YOY
Apr ’15 U.S. dry whey production of 77.4 million pounds declined 7.5% MOM on a daily average basis but remained significantly higher YOY, increased by 18.1% as manufacturers continue to shift away from higher-value whey protein products. The YOY increase in whey protein production was the third largest experienced in the past 12 years on a percentage basis, trailing only the Jan ’15 and Feb ’15 increases. Combined whey protein concentrates (WPC) and whey protein isolates (WPI) production remained lower on a YOY basis, declining by 5.4% YOY. Combined WPC and WPI production increased by 18.3% YOY throughout the ’13-’14 production season but has dropped below last year’s levels throughout the first seven months of the ’14-’15 production season, down 2.3% YTD. ’14-’15 YTD dry whey production is up 5.7% YOY, with total combined dry whey, WPC and WPI production up 2.2% YOY through April.
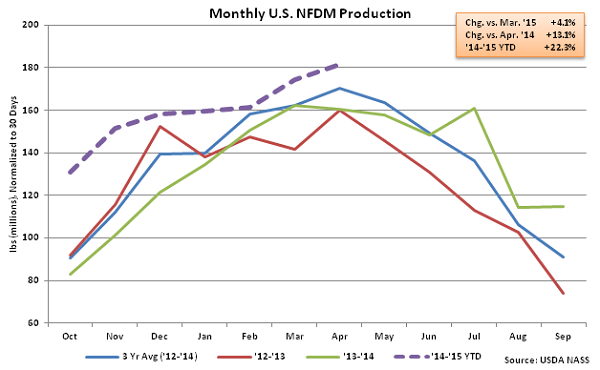
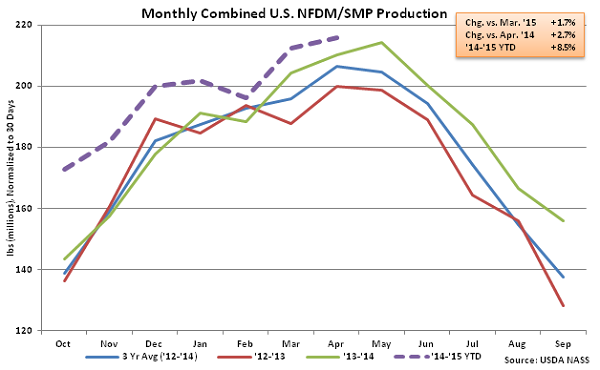
 NFDM/SMP – Combined Production Remains Higher on YOY Basis, up 2.7%
Apr ’15 U.S. NFDM production of 181.4 million pounds increased YOY for the 15th consecutive month, finishing up 13.1%. NFDM production also increased MOM on a daily average basis, increasing by 4.1% to the highest monthly figure experienced in the past 35 months. SMP production remained weak, with Apr ’15 production of 34.5 million lbs declined YOY for the 11th consecutive month, falling 30.9%. Apr ’15 combined production of NFDM and SMP increased 2.7% YOY, the 14th consecutive monthly increase in production. ’14-’15 YTD combined U.S. NFDM and SMP production is up 8.5% through the first seven months of the production season.
NFDM/SMP – Combined Production Remains Higher on YOY Basis, up 2.7%
Apr ’15 U.S. NFDM production of 181.4 million pounds increased YOY for the 15th consecutive month, finishing up 13.1%. NFDM production also increased MOM on a daily average basis, increasing by 4.1% to the highest monthly figure experienced in the past 35 months. SMP production remained weak, with Apr ’15 production of 34.5 million lbs declined YOY for the 11th consecutive month, falling 30.9%. Apr ’15 combined production of NFDM and SMP increased 2.7% YOY, the 14th consecutive monthly increase in production. ’14-’15 YTD combined U.S. NFDM and SMP production is up 8.5% through the first seven months of the production season.
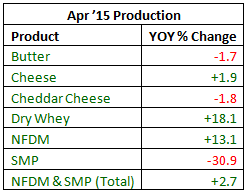
 See the table below for a summary of key U.S. dairy product production in Apr ’15.
Cheese – Production Sets New Monthly Record High
Apr ’15 total cheese production of 979.1 million pounds increased YOY for the 25th consecutive month, finishing 1.9% higher than last year. Total cheese production also increased 1.6% MOM on a daily average basis, finishing at the highest monthly figure on record. Record cheese production was achieved despite cheddar cheese production of 280.5 million pounds finishing 1.8% below the prior year. ’14-’15 YTD cheese production is up 2.8% YOY through the first seven months of the production season with cheddar cheese production up 2.1% over the same period. The 2.8% increase in annual cheese production would be a five year high.
Dry Whey – Production Remains Significantly Higher YOY
Apr ’15 U.S. dry whey production of 77.4 million pounds declined 7.5% MOM on a daily average basis but remained significantly higher YOY, increased by 18.1% as manufacturers continue to shift away from higher-value whey protein products. The YOY increase in whey protein production was the third largest experienced in the past 12 years on a percentage basis, trailing only the Jan ’15 and Feb ’15 increases. Combined whey protein concentrates (WPC) and whey protein isolates (WPI) production remained lower on a YOY basis, declining by 5.4% YOY. Combined WPC and WPI production increased by 18.3% YOY throughout the ’13-’14 production season but has dropped below last year’s levels throughout the first seven months of the ’14-’15 production season, down 2.3% YTD. ’14-’15 YTD dry whey production is up 5.7% YOY, with total combined dry whey, WPC and WPI production up 2.2% YOY through April.
NFDM/SMP – Combined Production Remains Higher on YOY Basis, up 2.7%
Apr ’15 U.S. NFDM production of 181.4 million pounds increased YOY for the 15th consecutive month, finishing up 13.1%. NFDM production also increased MOM on a daily average basis, increasing by 4.1% to the highest monthly figure experienced in the past 35 months. SMP production remained weak, with Apr ’15 production of 34.5 million lbs declined YOY for the 11th consecutive month, falling 30.9%. Apr ’15 combined production of NFDM and SMP increased 2.7% YOY, the 14th consecutive monthly increase in production. ’14-’15 YTD combined U.S. NFDM and SMP production is up 8.5% through the first seven months of the production season.
See the table below for a summary of key U.S. dairy product production in Apr ’15.