U.S. Livestock & Meat Trade Update – Apr ’15
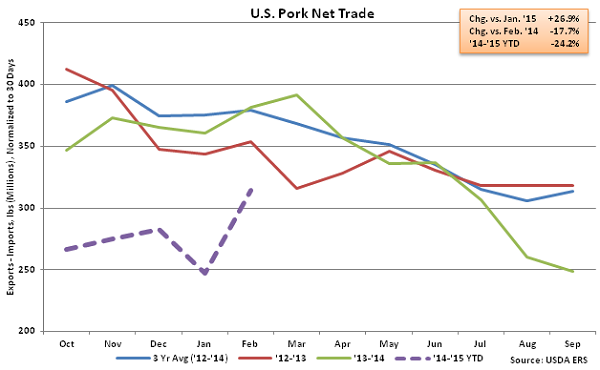
Pork – Net Trade Rebounds off Four Year Low, Remains Lower YOY
Feb ’15 U.S. pork export volumes increased 11.8% MOM on a daily average basis off of the five year low experienced in Jan ’15 but remained lower YOY, declining 10.1%. The monthly YOY decline was the eighth in a row after seven consecutive months of YOY export volume increases were experienced from Dec ’13 – Jun ’14. Of the major U.S. pork export destinations, YOY volume declines continue to be led by Japan, with shipments down 16.0% YOY. Exports destined to Mexico and Canada increased YOY for the first time in four and five months, respectively, with export volumes to Mexico increasing by 11.6% and export volumes to Canada increasing by 1.3%. Exports destined to South Korea remained strong, increasing YOY for the 13th consecutive month, finishing 80.7% higher. U.S. pork exports to Mexico, Japan, South Korea and Canada accounted for over 80% of all pork export volumes in Feb ’15. Increased demand resulted in pork export volumes reaching an eight month high on a daily average basis.
Feb ’15 U.S. pork imports remained strong, increasing 32.2% YOY and 1.2% MOM on a daily average basis. U.S. pork imports have increased YOY for 12 consecutive months which, when coupled with the YOY declines in exports, has resulted in a continued decline in YOY U.S. pork net trade figures. Feb ’15 net pork trade increased 26.9% MOM on a daily average basis but remained lower YOY for the eighth consecutive month, finishing down 17.7%.
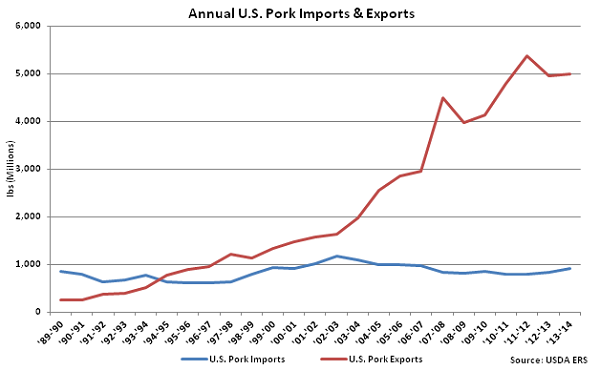
 U.S. pork export volumes have strengthened considerably over the past 25 years, increasing at a compound annual growth rate (CAGR) of 13.2%, while U.S. pork imports have remained fairly flat, increasing at a CAGR of 0.3% over the same time period. ’13-’14 annual pork imports experienced much stronger growth, finishing 10.5% higher than the previous year, the largest YOY percentage gain in 11 years. Despite the increase in pork imports, ’13-’14 annual pork exports volumes remained over five times as large as import volumes.
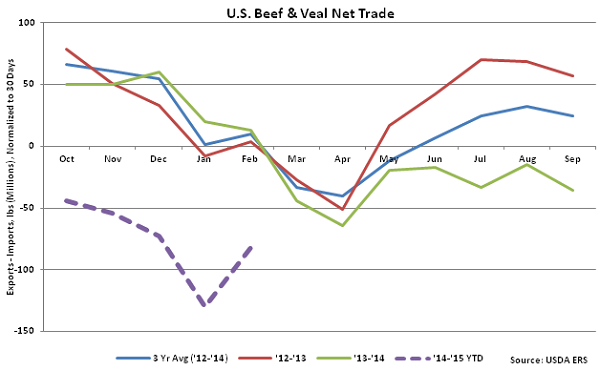
 Beef & Veal – Net Trade Off Historic Low, Remains Negative for 12th Consecutive Month
Feb ’15 U.S. beef & veal export volumes increased 21.1% MOM from the five year low experienced in Jan ’15 but remained lower on a YOY basis, declining 2.6%. Of the major import destinations, YOY declines in export volumes were led by Canada (-17.8%), followed by Mexico (-16.4%) and combined volumes to Hong Kong, Taiwan and China (-16.0%). Export volumes to South Korea and Japan each increased YOY for the first time in three months, increasing by 19.0% and 9.3%, respectively. U.S. beef & veal exports to the aforementioned countries accounted for over 85% of all beef & veal export volumes in Feb ’15.
Feb ’15 U.S. beef & veal imports declined 5.0% MOM on a daily average basis off of the seven and a half year high experienced in Jan ’15 but remained strong on a YOY basis, increasing 48.8%. Beef & veal import volumes exceeded export volumes for the 12th consecutive month in Feb ’15, with import volumes exceeding export volumes by 24.5% over the period.
Beef & Veal – Net Trade Off Historic Low, Remains Negative for 12th Consecutive Month
Feb ’15 U.S. beef & veal export volumes increased 21.1% MOM from the five year low experienced in Jan ’15 but remained lower on a YOY basis, declining 2.6%. Of the major import destinations, YOY declines in export volumes were led by Canada (-17.8%), followed by Mexico (-16.4%) and combined volumes to Hong Kong, Taiwan and China (-16.0%). Export volumes to South Korea and Japan each increased YOY for the first time in three months, increasing by 19.0% and 9.3%, respectively. U.S. beef & veal exports to the aforementioned countries accounted for over 85% of all beef & veal export volumes in Feb ’15.
Feb ’15 U.S. beef & veal imports declined 5.0% MOM on a daily average basis off of the seven and a half year high experienced in Jan ’15 but remained strong on a YOY basis, increasing 48.8%. Beef & veal import volumes exceeded export volumes for the 12th consecutive month in Feb ’15, with import volumes exceeding export volumes by 24.5% over the period.
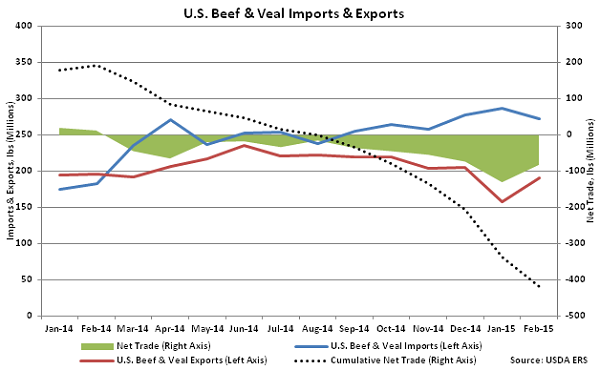
 Recent strength in beef & veal imports resulted in ’13-’14 annual U.S. beef & veal imports finishing higher than annual U.S. beef & veal exports for the first time in four years, with this trend continuing into the ’14-’15 production season. Feb ’15 beef & veal net trade increased from the seven and a half year low experienced in Jan ’15, but remained at the second lowest figure experienced over the past five and a half years.
 Chicken – Net Trade Remains Significantly Lower on YOY Basis
Feb ’15 U.S. broiler export volumes increased 3.9% MOM on a daily average basis off of the two year low experienced in Jan ’15 but remained lower YOY, declining 17.0%. Monthly export volumes have declined YOY for five consecutive months as the broiler export market continues to be negatively affected by the Russian import ban. Russia accounted for 8.2% of U.S. broiler export volumes throughout the ’12-’13 production season. U.S. broiler export volumes to Mexico remained strong, increasing on a YOY basis for the 15th consecutive month and finishing up 1.7% YOY. Broiler export volumes to Mexico have accounted for over a fifth of total broiler export volumes over the past 12 months.
Feb ’15 U.S. broiler imports increased 16.7% YOY and 34.8% MOM on a daily average basis. Despite the significant growth, broiler imports remain at insignificant levels relative to export volumes, with Feb ’15 imports amounting to only 2.1% of export volumes. Feb ’15 net broiler trade increased 3.3% MOM on a daily average basis off of the two year experienced in Jan ’15 but remained lower YOY, declining 17.5%. The Feb ’15 monthly YOY decline in net trade was the largest in five years on a percentage basis.
Chicken – Net Trade Remains Significantly Lower on YOY Basis
Feb ’15 U.S. broiler export volumes increased 3.9% MOM on a daily average basis off of the two year low experienced in Jan ’15 but remained lower YOY, declining 17.0%. Monthly export volumes have declined YOY for five consecutive months as the broiler export market continues to be negatively affected by the Russian import ban. Russia accounted for 8.2% of U.S. broiler export volumes throughout the ’12-’13 production season. U.S. broiler export volumes to Mexico remained strong, increasing on a YOY basis for the 15th consecutive month and finishing up 1.7% YOY. Broiler export volumes to Mexico have accounted for over a fifth of total broiler export volumes over the past 12 months.
Feb ’15 U.S. broiler imports increased 16.7% YOY and 34.8% MOM on a daily average basis. Despite the significant growth, broiler imports remain at insignificant levels relative to export volumes, with Feb ’15 imports amounting to only 2.1% of export volumes. Feb ’15 net broiler trade increased 3.3% MOM on a daily average basis off of the two year experienced in Jan ’15 but remained lower YOY, declining 17.5%. The Feb ’15 monthly YOY decline in net trade was the largest in five years on a percentage basis.
 U.S. broiler export volumes have strengthened considerably over the past 25 years, increasing at a compound annual growth rate (CAGR) of 18.3%. U.S. broiler import volumes have increased at a CAGR of 21.6% over the same time period but remain significantly lower. ’13-’14 annual broiler exports volumes were over 60 times as large as import volumes.
U.S. pork export volumes have strengthened considerably over the past 25 years, increasing at a compound annual growth rate (CAGR) of 13.2%, while U.S. pork imports have remained fairly flat, increasing at a CAGR of 0.3% over the same time period. ’13-’14 annual pork imports experienced much stronger growth, finishing 10.5% higher than the previous year, the largest YOY percentage gain in 11 years. Despite the increase in pork imports, ’13-’14 annual pork exports volumes remained over five times as large as import volumes.
Beef & Veal – Net Trade Off Historic Low, Remains Negative for 12th Consecutive Month
Feb ’15 U.S. beef & veal export volumes increased 21.1% MOM from the five year low experienced in Jan ’15 but remained lower on a YOY basis, declining 2.6%. Of the major import destinations, YOY declines in export volumes were led by Canada (-17.8%), followed by Mexico (-16.4%) and combined volumes to Hong Kong, Taiwan and China (-16.0%). Export volumes to South Korea and Japan each increased YOY for the first time in three months, increasing by 19.0% and 9.3%, respectively. U.S. beef & veal exports to the aforementioned countries accounted for over 85% of all beef & veal export volumes in Feb ’15.
Feb ’15 U.S. beef & veal imports declined 5.0% MOM on a daily average basis off of the seven and a half year high experienced in Jan ’15 but remained strong on a YOY basis, increasing 48.8%. Beef & veal import volumes exceeded export volumes for the 12th consecutive month in Feb ’15, with import volumes exceeding export volumes by 24.5% over the period.
Recent strength in beef & veal imports resulted in ’13-’14 annual U.S. beef & veal imports finishing higher than annual U.S. beef & veal exports for the first time in four years, with this trend continuing into the ’14-’15 production season. Feb ’15 beef & veal net trade increased from the seven and a half year low experienced in Jan ’15, but remained at the second lowest figure experienced over the past five and a half years.
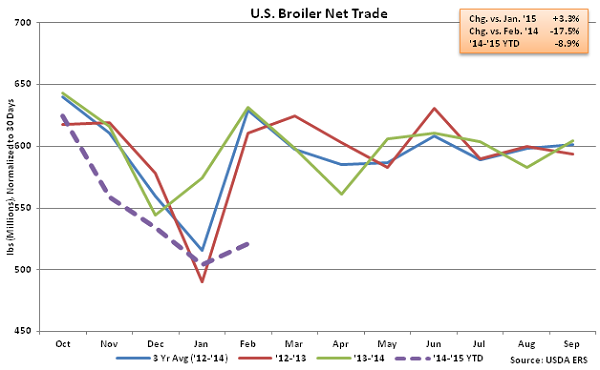
Chicken – Net Trade Remains Significantly Lower on YOY Basis
Feb ’15 U.S. broiler export volumes increased 3.9% MOM on a daily average basis off of the two year low experienced in Jan ’15 but remained lower YOY, declining 17.0%. Monthly export volumes have declined YOY for five consecutive months as the broiler export market continues to be negatively affected by the Russian import ban. Russia accounted for 8.2% of U.S. broiler export volumes throughout the ’12-’13 production season. U.S. broiler export volumes to Mexico remained strong, increasing on a YOY basis for the 15th consecutive month and finishing up 1.7% YOY. Broiler export volumes to Mexico have accounted for over a fifth of total broiler export volumes over the past 12 months.
Feb ’15 U.S. broiler imports increased 16.7% YOY and 34.8% MOM on a daily average basis. Despite the significant growth, broiler imports remain at insignificant levels relative to export volumes, with Feb ’15 imports amounting to only 2.1% of export volumes. Feb ’15 net broiler trade increased 3.3% MOM on a daily average basis off of the two year experienced in Jan ’15 but remained lower YOY, declining 17.5%. The Feb ’15 monthly YOY decline in net trade was the largest in five years on a percentage basis.
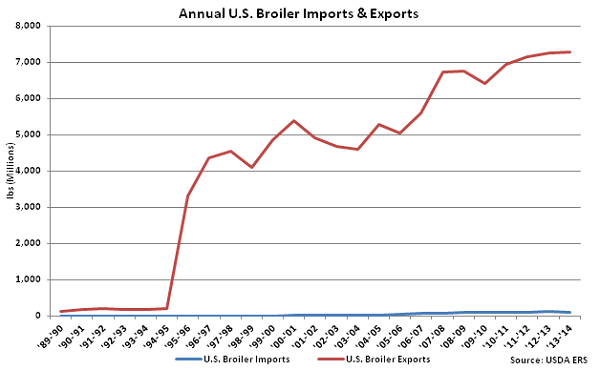
U.S. broiler export volumes have strengthened considerably over the past 25 years, increasing at a compound annual growth rate (CAGR) of 18.3%. U.S. broiler import volumes have increased at a CAGR of 21.6% over the same time period but remain significantly lower. ’13-’14 annual broiler exports volumes were over 60 times as large as import volumes.