Global Dairy Trade Biannual Chart Focus Update – Apr…
The GlobalDairyTrade (GDT) recently released their biannual Chart Focus report including updated data on several key indicators within the GDT from Jan ’14 – Dec ’14. Information on quantities sold by product, participating bidders by region, quantities sold by contract period, participating bidders by product, and quantities sold by product were provided within the report.
Volume sold by product within the GDT as a percentage of total product sold remained largely unchanged from 2013. Volume sold by product as a percentage of total product sold increased for SMP while declining for WMP.
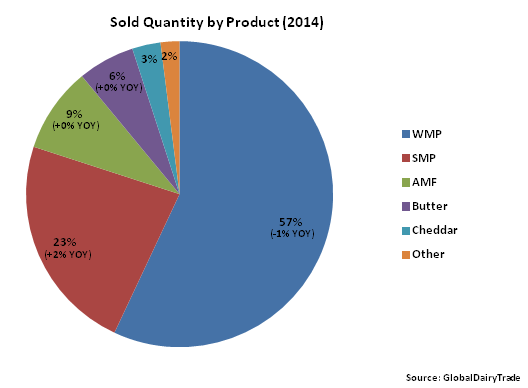 Product was sold from Fonterra (New Zealand), Dairy America (U.S.), Land O’Lakes (U.S.), Amul (India), Murray Goulburn (Australia), Arla (Europe), Euroserum (Europe) and Molkerei Ammerland (Europe). Molkerei Ammerland joined the seven existing sellers within the GDT in Sep ’14, offering sweet whey powder for the first time on the platform.
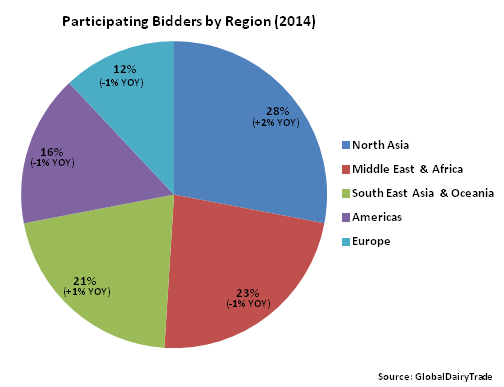
Market share of participating bidders by region remained largely unchanged from 2013. Market share of participating bidders by region increased in North Asia (up 2% YOY) and South East Asia & Oceania (up 1% YOY) while decreasing in the Middle East & Africa (down 1% YOY), the Americas (down 1% YOY) and Europe (down 1% YOY).
Product was sold from Fonterra (New Zealand), Dairy America (U.S.), Land O’Lakes (U.S.), Amul (India), Murray Goulburn (Australia), Arla (Europe), Euroserum (Europe) and Molkerei Ammerland (Europe). Molkerei Ammerland joined the seven existing sellers within the GDT in Sep ’14, offering sweet whey powder for the first time on the platform.
Market share of participating bidders by region remained largely unchanged from 2013. Market share of participating bidders by region increased in North Asia (up 2% YOY) and South East Asia & Oceania (up 1% YOY) while decreasing in the Middle East & Africa (down 1% YOY), the Americas (down 1% YOY) and Europe (down 1% YOY).
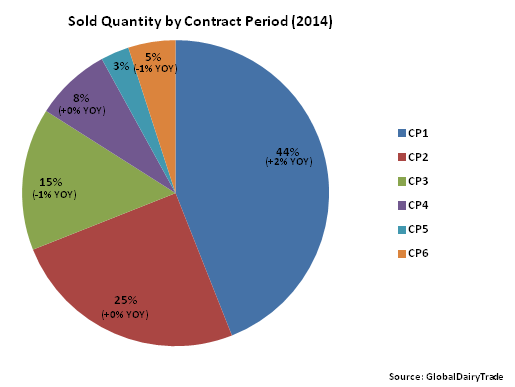
 Over two thirds of the total product sold remained in short-term contract periods (CP1 & CP2). Product sold in contract period one increased the most, while total product sold for more deferred contracts declined.
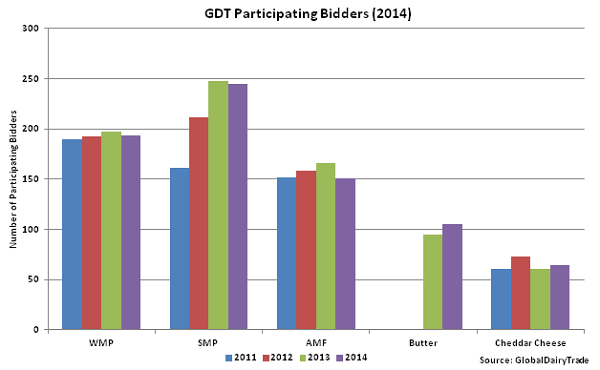
 Participating bidders who actively bid on product in at least one trading event over the 12 month period declined YOY for WMP, SMP and AMF but increased for butter and cheddar cheese.
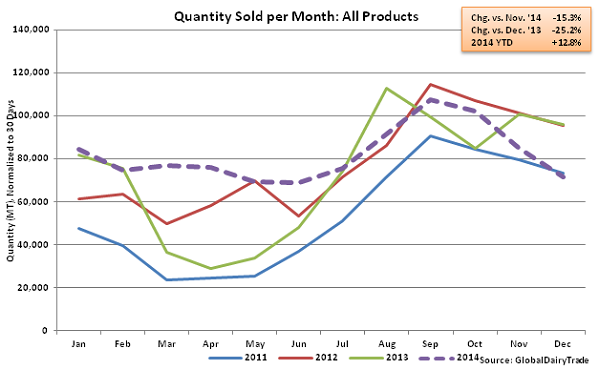
 Combined quantities sold per month for all products finished 12.8% higher for the year, but declined significantly in the later portion of 2014. Dec ’14 quantities sold declined 25.2% YOY and 15.3% MOM on a daily average basis.
Product was sold from Fonterra (New Zealand), Dairy America (U.S.), Land O’Lakes (U.S.), Amul (India), Murray Goulburn (Australia), Arla (Europe), Euroserum (Europe) and Molkerei Ammerland (Europe). Molkerei Ammerland joined the seven existing sellers within the GDT in Sep ’14, offering sweet whey powder for the first time on the platform.
Market share of participating bidders by region remained largely unchanged from 2013. Market share of participating bidders by region increased in North Asia (up 2% YOY) and South East Asia & Oceania (up 1% YOY) while decreasing in the Middle East & Africa (down 1% YOY), the Americas (down 1% YOY) and Europe (down 1% YOY).
Over two thirds of the total product sold remained in short-term contract periods (CP1 & CP2). Product sold in contract period one increased the most, while total product sold for more deferred contracts declined.
Participating bidders who actively bid on product in at least one trading event over the 12 month period declined YOY for WMP, SMP and AMF but increased for butter and cheddar cheese.
Combined quantities sold per month for all products finished 12.8% higher for the year, but declined significantly in the later portion of 2014. Dec ’14 quantities sold declined 25.2% YOY and 15.3% MOM on a daily average basis.