USDA Quarterly Hog and Pig Report Summary – Jun…
Executive Summary
Quarterly U.S. hog and pig figures provided by USDA were recently updated with values spanning through Jun ’16. Highlights from the updated report include:
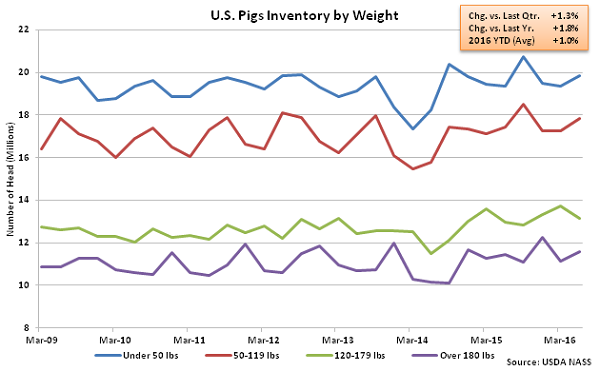
• The U.S. pig inventory remained higher on a YOY basis for the seventh consecutive quarter during Jun ’16, finishing 1.8% above the previous year.
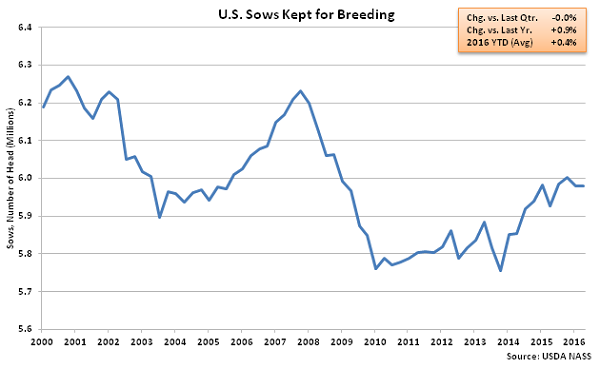
• U.S. sows kept for breeding remained 0.4% below the recently experienced seven year high but finished up 0.9% YOY.
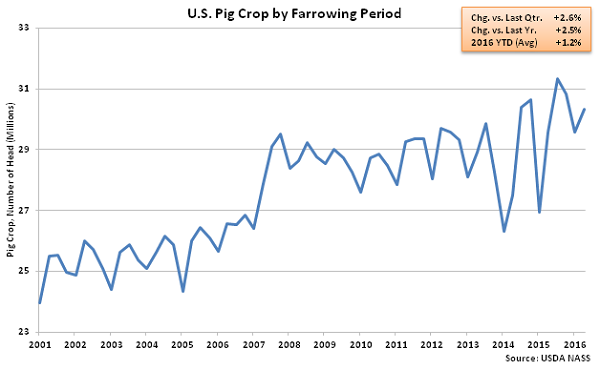
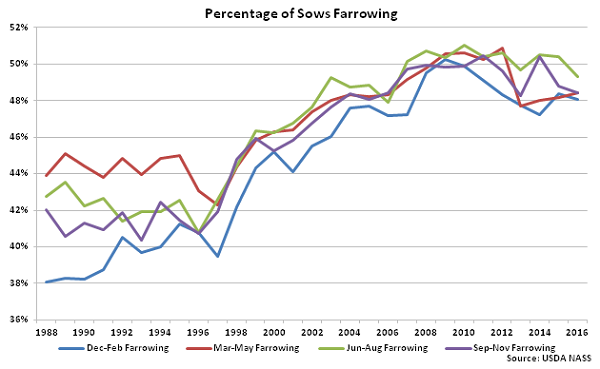
• U.S. farrowing rates for the Mar ’16 – May ’16 period finished up 1.5% YOY however farrowing intentions remained lower on a YOY basis throughout the third and fourth quarters of 2016.
Additional Report Details
According to USDA, June 1st inventories of pigs increased 1.3% from Mar ’16 inventory levels while also finishing 1.8% higher than the previous year. The YOY increase was the seventh experienced in a row however the 1.3% quarterly increase was less than the five year average March – June increase in inventories of 3.1%. On a YOY basis, weights 120 pounds or more increased 1.2% YOY while weights less than 120 pounds increased by 2.4% YOY.
 Jun ’16 sows kept for breeding remained 0.4% below the seven year high experienced during Dec ’15 but finished 0.9% higher on a YOY basis. Sows kept for breeding have increased on a YOY basis over seven of the past eight quarters through Jun ’16. The recent increases in sows kept for breeding correlates with a period of very low slaughter rates.
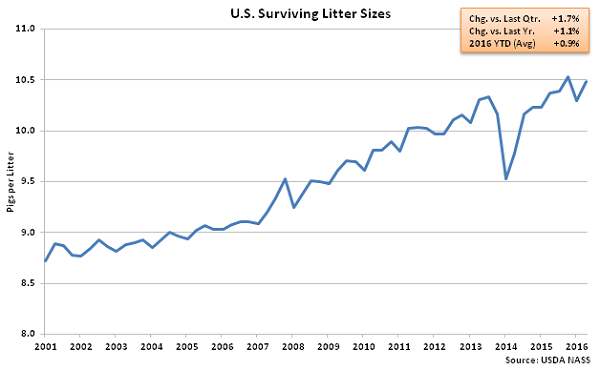
 Both litter and farrowing rates continued to rebound from the PED suppressed levels in prior quarters. Mar ’16 – May ’16 weaned pigs saved per litter remained 0.5% below the record high experienced during the Sep ’15 – Nov ’15 period but increased on a YOY basis for the seventh consecutive quarter, finishing up 1.1%. Surviving litter sizes finished up 4.6% YOY during 2015 when compared to the previous PED suppressed litter rates while litter sizes increased to a record seasonal high during Jun ’16. Normally, litter sizes have historically only increased YOY due to improving genetics and production practices.
Mar ’16 – May ’16 farrowing rates increased 0.8% from the previous quarter and 1.5% from the previous year however farrowing intentions were down 2.3% and 1.1% YOY, respectively, for the Jun ’16 – Aug ’16 and the Sep ’16 – Nov ’16 periods. Sows farrowing during the March – May period represented 48.4% of the breeding herd.
Both litter and farrowing rates continued to rebound from the PED suppressed levels in prior quarters. Mar ’16 – May ’16 weaned pigs saved per litter remained 0.5% below the record high experienced during the Sep ’15 – Nov ’15 period but increased on a YOY basis for the seventh consecutive quarter, finishing up 1.1%. Surviving litter sizes finished up 4.6% YOY during 2015 when compared to the previous PED suppressed litter rates while litter sizes increased to a record seasonal high during Jun ’16. Normally, litter sizes have historically only increased YOY due to improving genetics and production practices.
Mar ’16 – May ’16 farrowing rates increased 0.8% from the previous quarter and 1.5% from the previous year however farrowing intentions were down 2.3% and 1.1% YOY, respectively, for the Jun ’16 – Aug ’16 and the Sep ’16 – Nov ’16 periods. Sows farrowing during the March – May period represented 48.4% of the breeding herd.
Jun ’16 sows kept for breeding remained 0.4% below the seven year high experienced during Dec ’15 but finished 0.9% higher on a YOY basis. Sows kept for breeding have increased on a YOY basis over seven of the past eight quarters through Jun ’16. The recent increases in sows kept for breeding correlates with a period of very low slaughter rates.
Both litter and farrowing rates continued to rebound from the PED suppressed levels in prior quarters. Mar ’16 – May ’16 weaned pigs saved per litter remained 0.5% below the record high experienced during the Sep ’15 – Nov ’15 period but increased on a YOY basis for the seventh consecutive quarter, finishing up 1.1%. Surviving litter sizes finished up 4.6% YOY during 2015 when compared to the previous PED suppressed litter rates while litter sizes increased to a record seasonal high during Jun ’16. Normally, litter sizes have historically only increased YOY due to improving genetics and production practices.
Mar ’16 – May ’16 farrowing rates increased 0.8% from the previous quarter and 1.5% from the previous year however farrowing intentions were down 2.3% and 1.1% YOY, respectively, for the Jun ’16 – Aug ’16 and the Sep ’16 – Nov ’16 periods. Sows farrowing during the March – May period represented 48.4% of the breeding herd.