Soybean Complex Crushing & Stocks Update – May ’21
Executive Summary
U.S. soybean crush and stocks figures provided by the USDA were recently updated with values spanning through Mar ’21. Highlights from the updated report include:
- U.S. soybean crushings declined 2.0% on a YOY basis throughout Mar ’21, finishing lower for the second consecutive month.
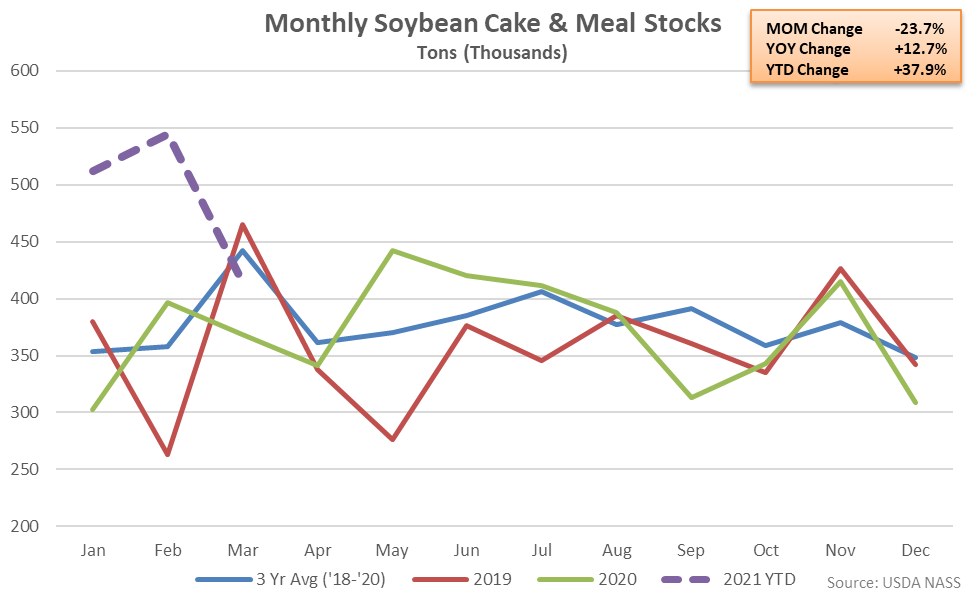
- Mar ’21 U.S. soybean cake & meal stocks declined contraseasonally from the record high level experienced throughout the previous month but remained higher on a YOY basis for the tenth time in the past 12 months, finishing up 12.7%.
- Mar ’21 U.S. soybean oil stocks remained lower on a YOY basis for the fourth consecutive month, finishing down 3.6%.
Additional Report Details
Soybean Crushing – Crush Declines YOY for the Second Consecutive Month, Finishes Down 2.0%
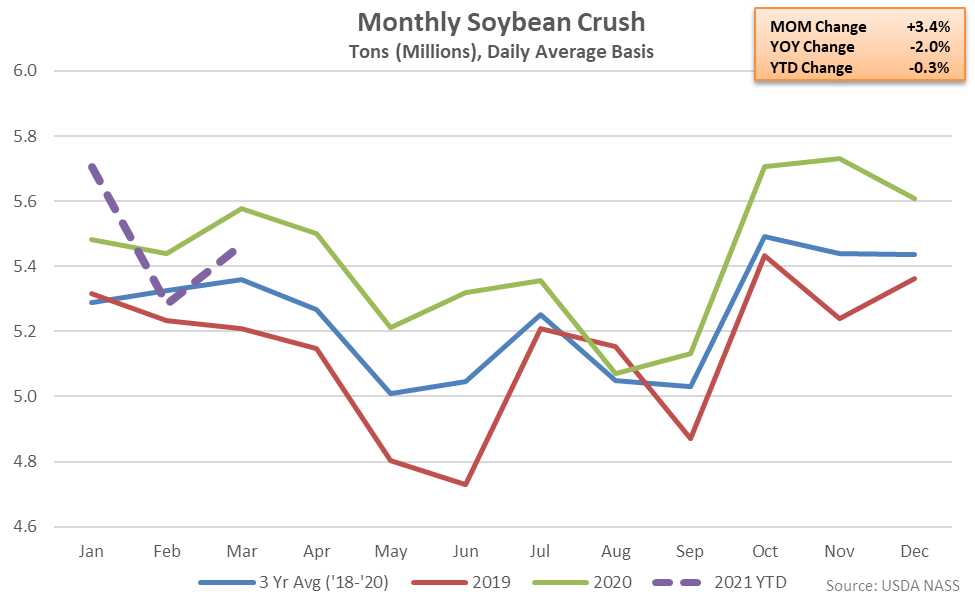
According to the USDA, Mar ’21 U.S. soybean crushings increased contraseasonally from the previous month but remained 2.0% lower on a YOY basis. The YOY decline in soybean crushings was the second experienced in a row but just the third throughout the past 16 months. Soybean crushings had reached record high seasonal levels over five consecutive months through Jan ’21, prior to declining on a YOY basis throughout the months of February and March.
Mar ’21 YOY declines in soybean crushings were largest throughout the North & East states of Indiana, Kentucky, Maryland, Ohio, Pennsylvania and Virginia. The 3.4% month-over-month increase in soybean crushings was a contraseasonal move when compared to the five year average February – March seasonal decline of 0.3%. 2020 annual soybean crushings finished 5.6% higher on a YOY basis, reaching a record high annual level, however 2021 YTD crushings have declined by 0.3% throughout the first quarter of the production season.
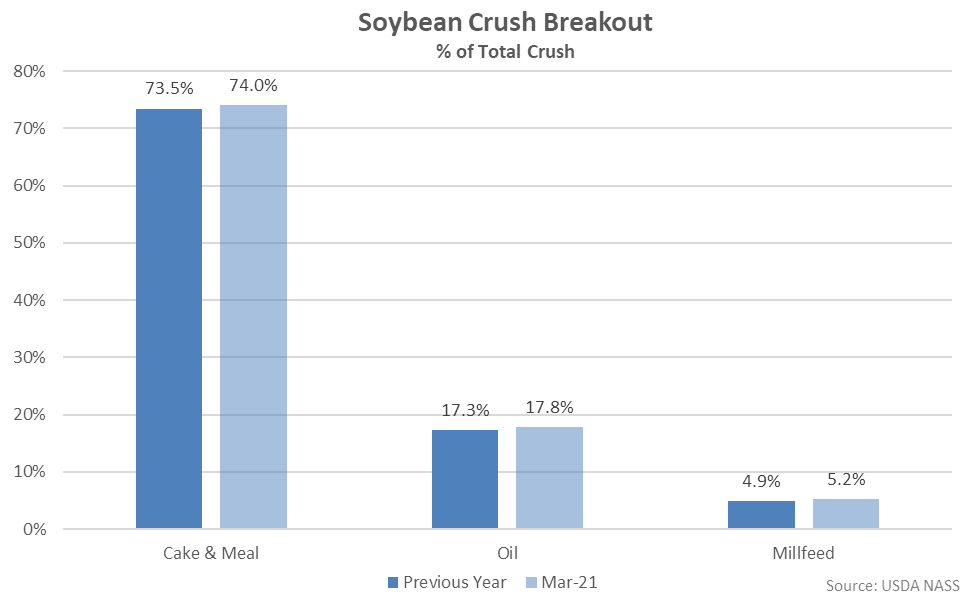
Cake & meal accounted for 74.1% of the total soybean crush throughout Mar ’21, up from the previous year, while oil accounted for 17.8% of the total soybean crush, also up from the previous year.
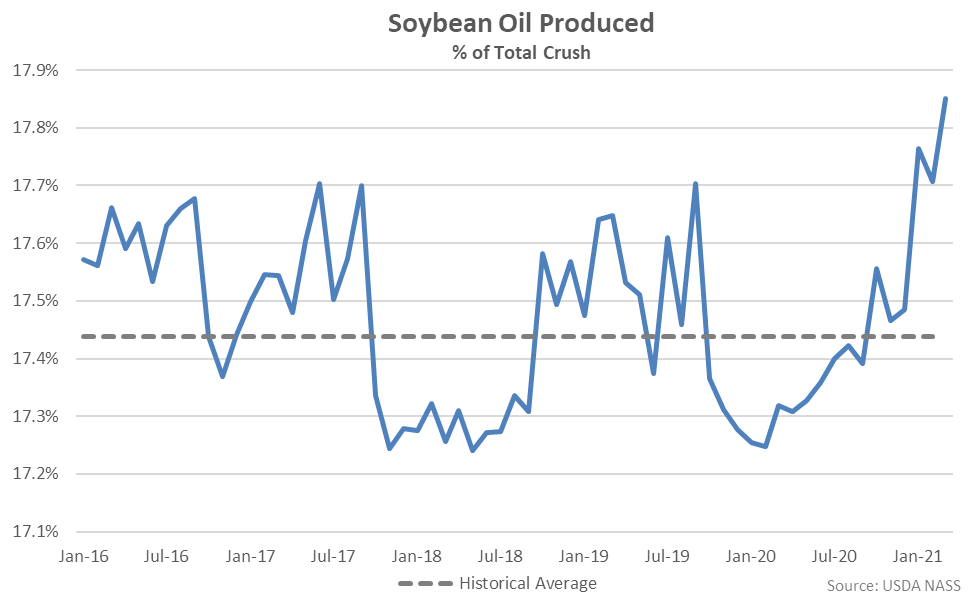
Mar ’21 soybean oil produced as a percentage of total crush reached a record high level, finishing above historical average figures for the sixth consecutive month. Soybean crush figures have been compiled since mid-2015.
Soybean Cake & Meal Stocks – Stocks Remain Higher YOY, Finish up 12.7%
Mar ’21 U.S. soybean cake & meal stocks declined from the record high level experienced throughout the previous month but remained higher on a YOY basis, finishing 12.7% above previous year levels. The YOY increase in soybean cake & meal stocks was the tenth experienced throughout the past 11 months. The month-over-month decline in soybean cake & meal stocks of 23.7% was a contraseasonal move when compared to the five year average February – March seasonal increase in stocks of 13.0%.
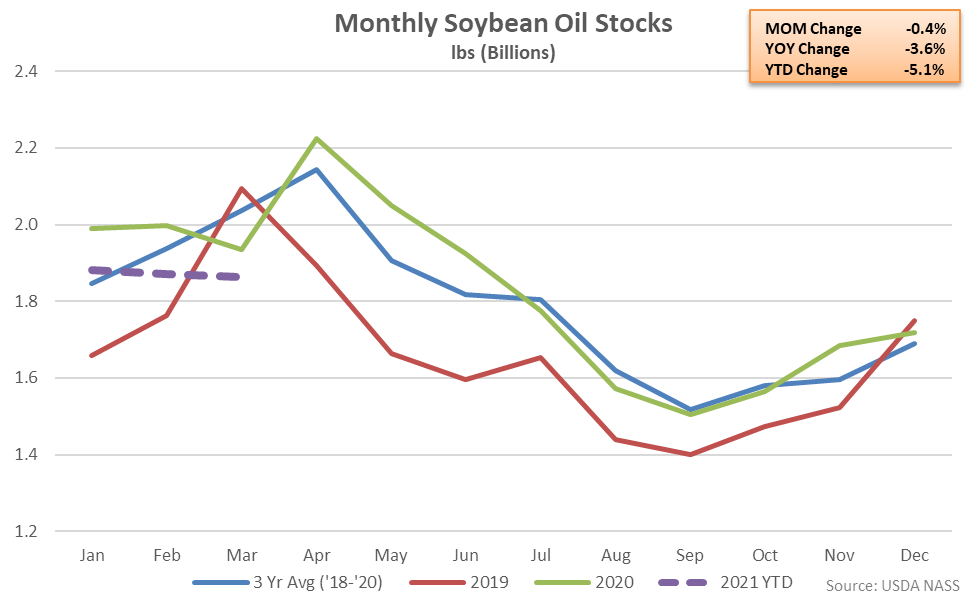
Soybean Oil Stocks – Stocks Remain Lower YOY for the Fourth Consecutive Month, Down 3.6%
U.S. soybean oil stocks declined contraseasonally to a three month low level throughout Mar ’21 while finishing 3.6% lower on a YOY basis. Soybean oil stocks have remained lower on a YOY basis over four consecutive months through Mar ’21. Soybean oil stocks had finished higher on a YOY basis over eight consecutive months through Nov ’20 prior to finishing lower throughout each of the past four months of available data. The month-over-month decline in soybean oil stocks of 0.4% was a contraseasonal move when compared to the five year average February – March seasonal increase of 5.7%.