U.S. Dairy Dry Product Stocks Update – Mar ’21
Executive Summary
U.S. dairy dry product stock figures provided by the USDA were recently updated with values spanning through Jan ’21. Highlights from the updated report include:
- U.S. dry whey stocks finished 7.1% above previous year figures throughout Jan ’21, increasing on a YOY basis for the first time in the past five months. Dry whey stocks remained significantly below three year average seasonal levels, however.
- U.S. nonfat dry milk stocks remained higher on a YOY basis for the fourth consecutive month throughout Jan ’21, finishing up 8.8% but remaining below the 2018 record high seasonal level.
Additional Report Details
Dry Whey – Stocks Increase YOY for the First Time in the Past Five Months, Finish up 7.1%
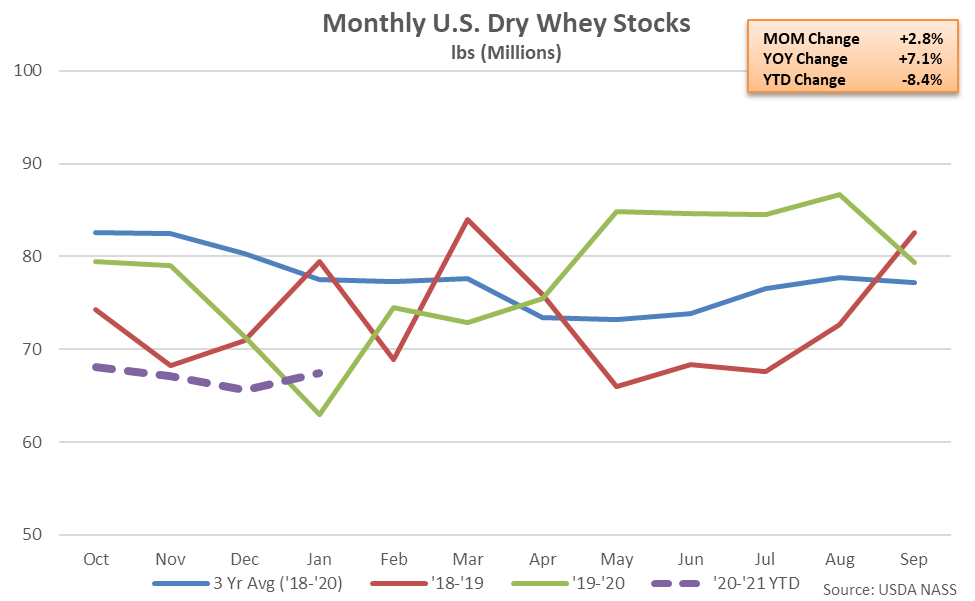
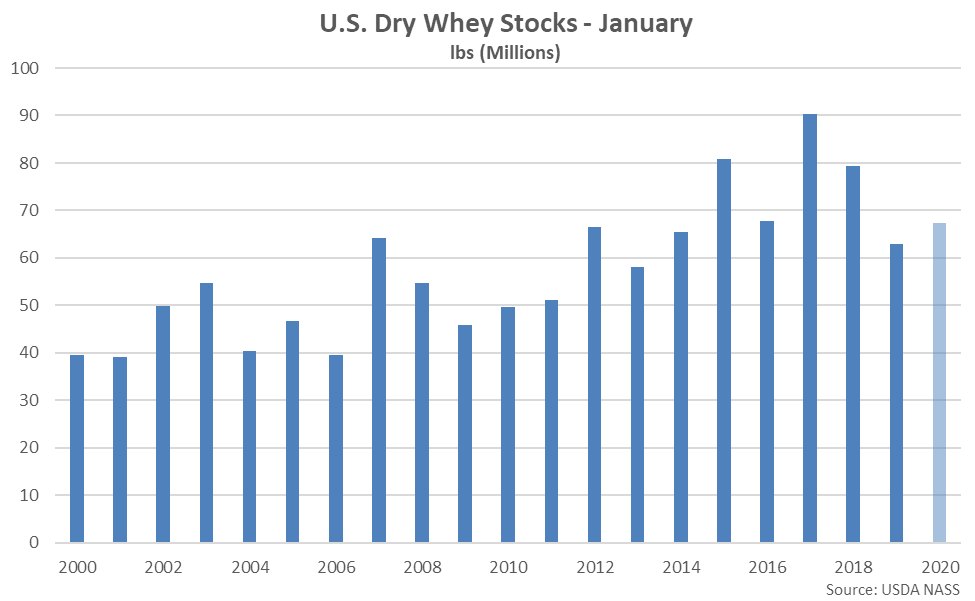
According to the USDA, Jan ’21 month-end dry whey stocks rebounded slightly from the 11 month low level experienced throughout the previous month while finishing 7.1% higher on a YOY basis. The YOY increase in dry whey stocks was the first experienced throughout the past five months. Dry whey stocks remained 13.0% below three year average seasonal levels for the month of January, however, finishing below three year average seasonal figures for the fifth consecutive month.
The month-over-month build in dry whey stocks of 1.8 million pounds, or 2.8%, was consistent with the ten year average December – January seasonal increase in dry whey stocks of 1.2 million pounds, or 2.6%. Dry whey production declined 0.4% on a YOY basis throughout Jan ’21, finishing below previous year figures for the fifth time in the past six months.
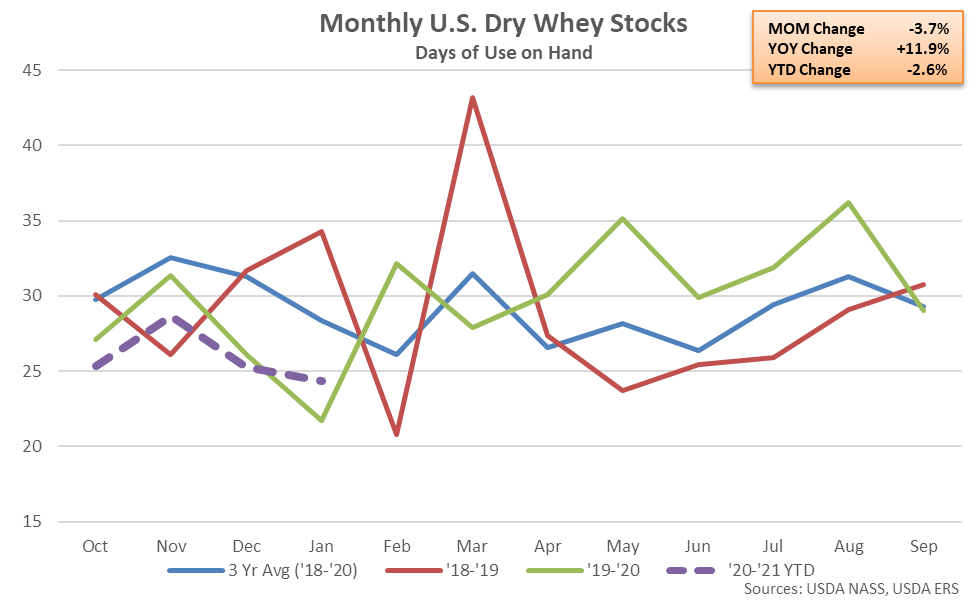
On a days of usage basis, Jan ’21 U.S. dry whey stocks also finished higher YOY. When assuming 12-month rolling average YOY changes in usage rates and known stock values for the month of January, dry whey stocks on a days of usage basis finished 11.9% higher YOY, increasing on a YOY basis for the first time in the past five months.
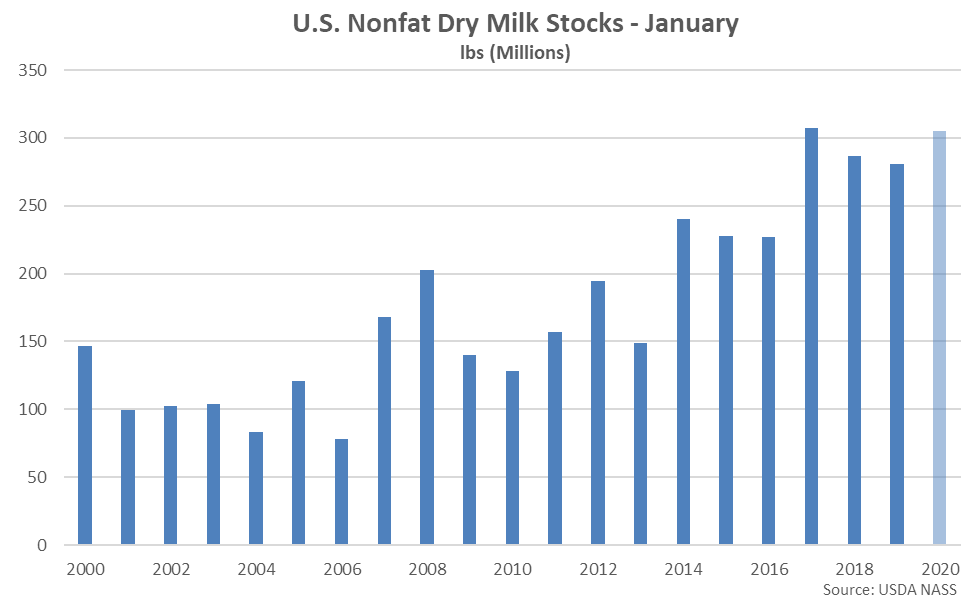
Nonfat Dry Milk – Stocks Finish Higher on a YOY Basis for the Fourth Consecutive Month, up 8.8%
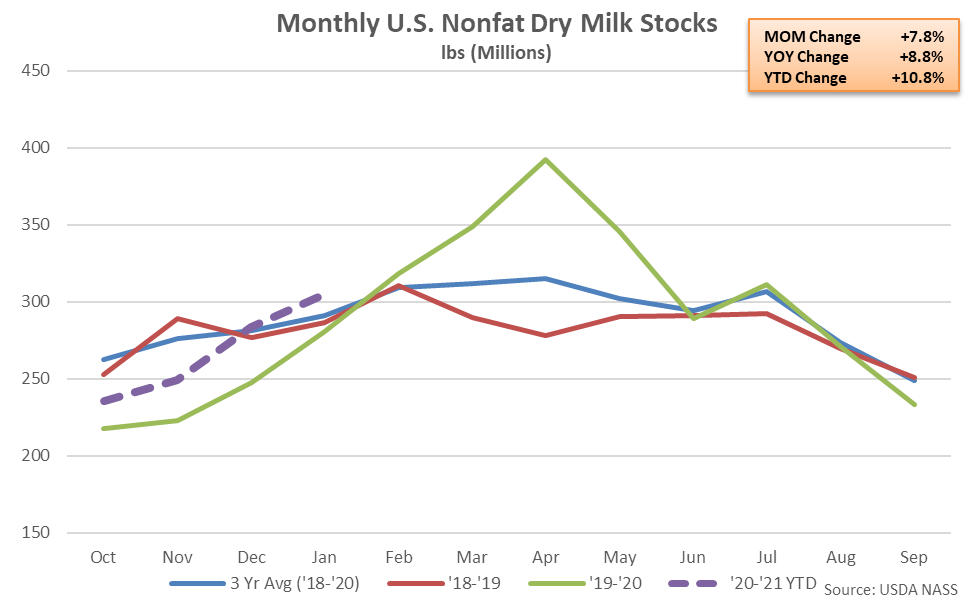
Jan ’21 month-end nonfat dry milk (NFDM) stocks increased seasonally to a six month high level while finishing 8.8% higher on a YOY basis. The YOY increase in NFDM stocks was fourth experienced in a row. NFDM stocks reached the second highest seasonal level on record but remained below the 2018 record high seasonal level.
The month-over-month increase in NFDM stocks of 22.0 million pounds, or 7.8%, was larger than the ten year average December – January seasonal increase in stocks of 5.6 million pounds, or 2.5%. NFDM production increased 11.7% on a YOY basis throughout Jan ’21, finishing higher for the sixth consecutive month.
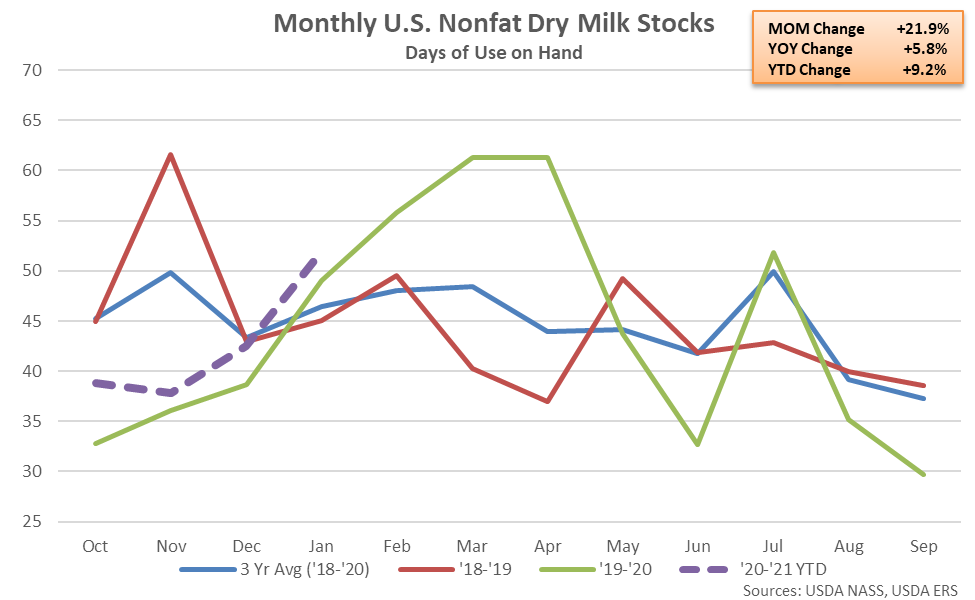
On a days of usage basis, Jan ’21 U.S. NFDM stocks also finished higher YOY. When assuming 12-month rolling average YOY changes in usage rates and known stock values for the month of January, NFDM stocks on a days of usage basis finished 5.8% above previous year figures, increasing on a YOY basis for the fourth consecutive month.
Combined Dairy Product Stocks – Stocks Remain at a Record High Seasonal Level, Finish up 8.0%
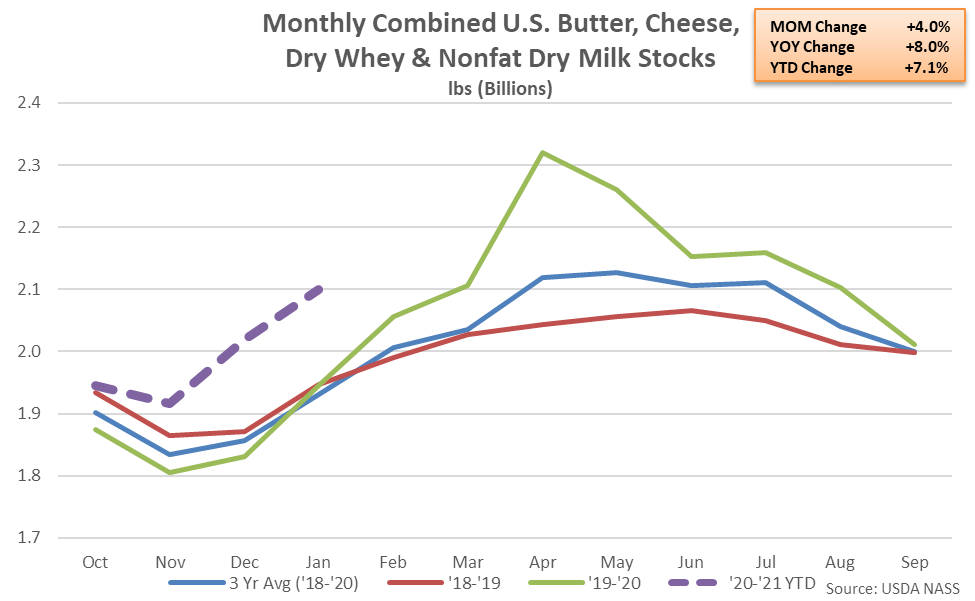
Jan ’21 combined stocks of butter, cheese, dry whey and NFDM increased seasonally to a five month high level while finishing 8.0% higher on a YOY basis. Combined stocks remained at a record high seasonal level for the 12th consecutive month.