Soybean Complex Crushing & Stocks Update – Mar ’21
Executive Summary
U.S. soybean crush and stocks figures provided by the USDA were recently updated with values spanning through Jan ’21. Highlights from the updated report include:
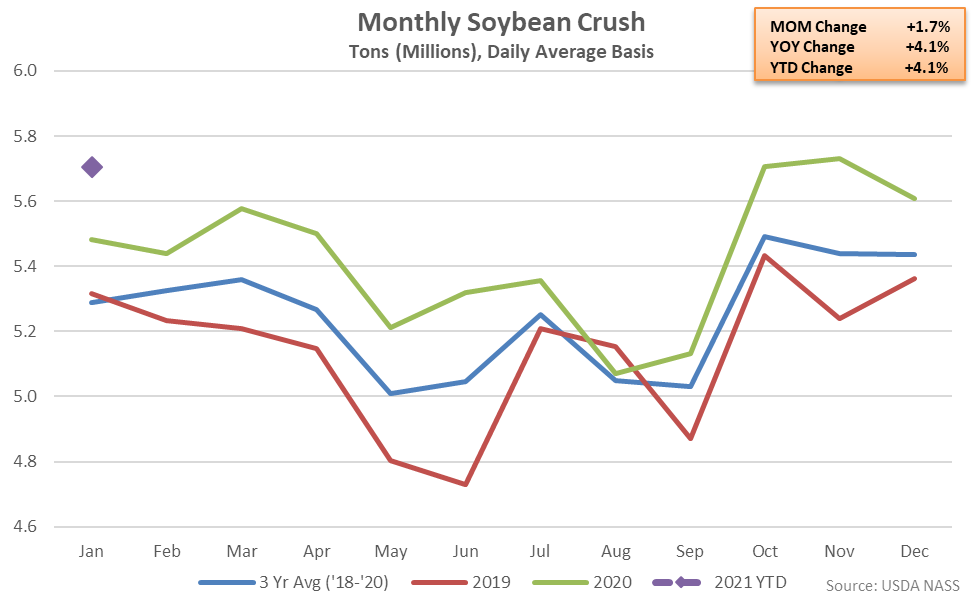
- U.S. soybean crushings increased 4.1% on a YOY basis throughout Jan ’21, remaining at a record high seasonal level for the fifth consecutive month.
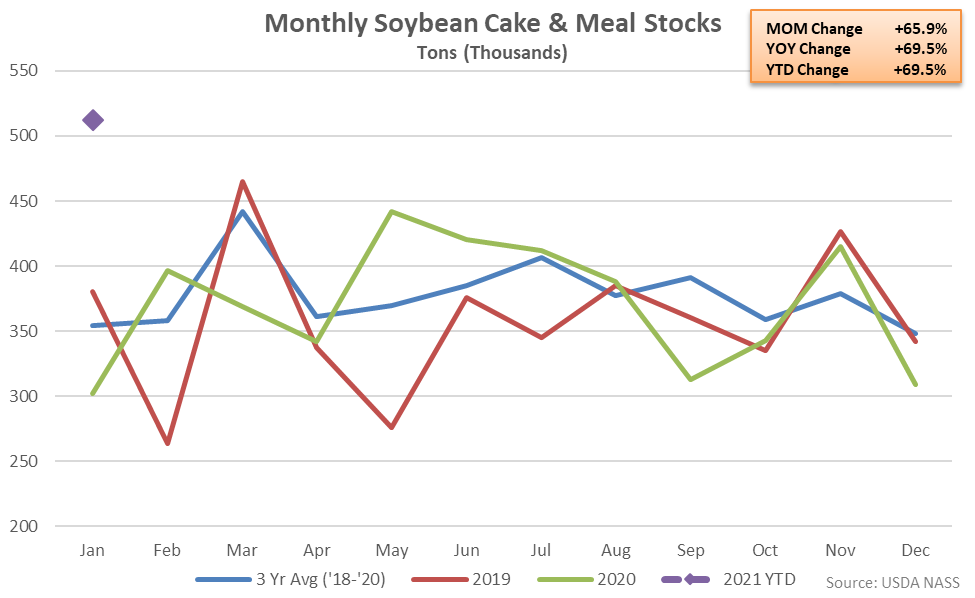
- U.S. soybean cake & meal stocks remained higher on a YOY basis for the eighth time in the past ten months throughout Jan ’21, finishing up 69.5% and reaching a record high monthly level.
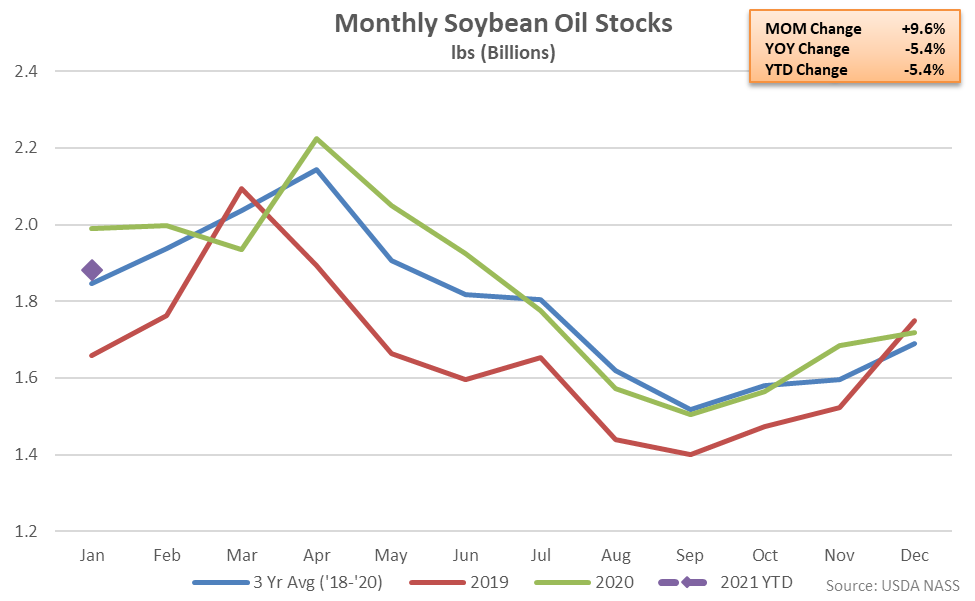
- Jan ’21 U.S. soybean oil stocks remained lower on a YOY basis for the second consecutive month, finishing down 5.4%.
Additional Report Details
Soybean Crushing – Crush Remains at a Record High Seasonal Level, Finishes up 4.1% YOY
According to the USDA, Jan ’21 U.S. soybean crushings increased contraseasonally from the previous month while finishing 4.1% higher on a YOY basis, reaching a record high seasonal level. The YOY increase in soybean crushings was the 13th experienced throughout the past 14 months. Soybean crushings have remained at a record high seasonal level over five consecutive months through Jan ’21.
Jan ’21 YOY increases in soybean crushings were largest throughout the North Central states of Michigan, Minnesota, North Dakota and South Dakota. The 1.7% month-over-month increase in soybean crushings was a contraseasonal move when compared to the five year average December – January seasonal decline of 0.3%. 2020 annual soybean crushings finished 5.6% higher on a YOY basis, reaching a record high annual level.
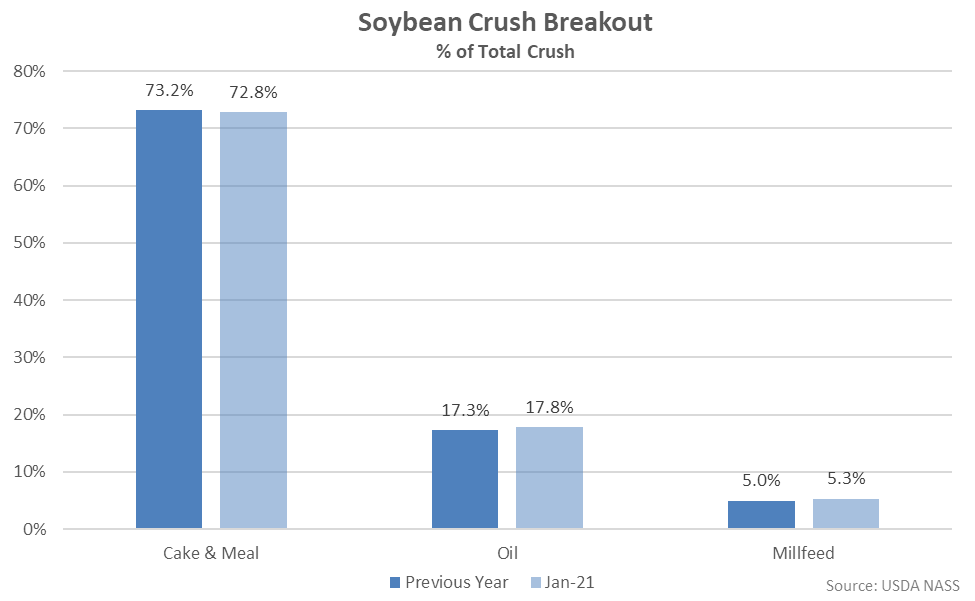
Cake & meal accounted for 72.8% of the total soybean crush throughout Jan ’21, down 0.4% from the previous year, while oil accounted for 17.8% of the total soybean crush, up 0.5% from the previous year.
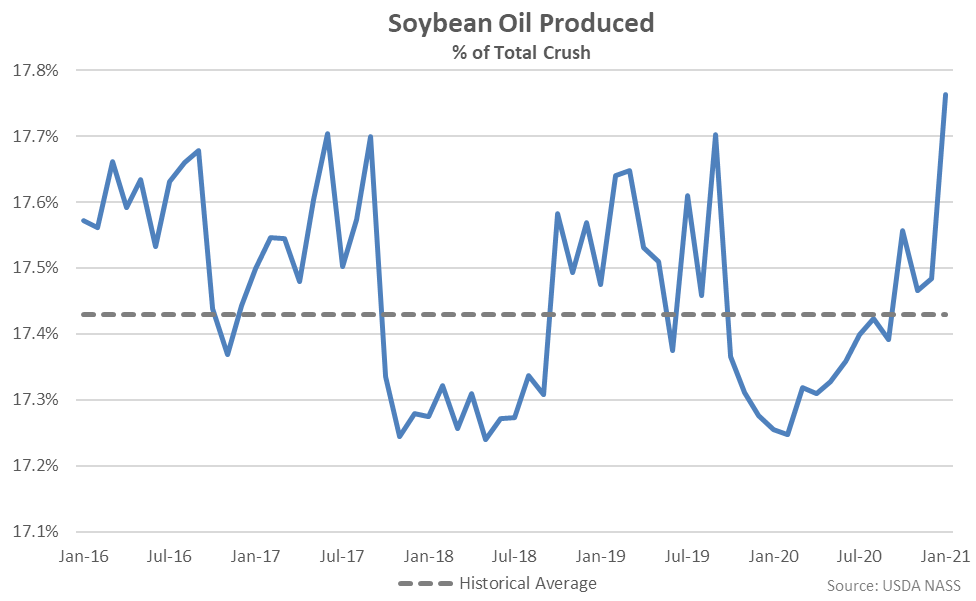
Jan ’21 soybean oil produced as a percentage of total crush increased to the highest monthly figure on record, finishing above historical average figures for the fourth consecutive month. Soybean crush figures have been compiled since mid-2015.
Soybean Cake & Meal Stocks – Stocks Reach a Record High Monthly Level, up 69.5% YOY
U.S. soybean cake & meal stocks increased sharply to a record high monthly level throughout Jan ’21, finishing 69.5% above previous year levels. Soybean cake & meal stocks have been compiled since mid-2015. The YOY increase in soybean cake & meal stocks was the eighth experienced throughout the past ten months and the largest on record. The month-over-month increase in soybean cake & meal stocks of 65.9% was a contraseasonal move when compared to the five year average December – January seasonal decline in stocks of 1.3%.
Soybean Oil Stocks – Stocks Remain Lower YOY for the Second Consecutive Month, Down 5.4%
Jan ’21 U.S. soybean oil stocks increased seasonally to a seven month high level but finished 5.4% lower on a YOY basis. The YOY decline in soybean oil stocks was the second experienced in a row. Soybean oil stocks had finished higher on a YOY basis over eight consecutive months through Nov ’20 prior to finishing lower throughout each of the past two months of data. The month-over-month increase in soybean oil stocks of 9.6% was slightly smaller than the five year average December – January seasonal increase of 12.2%.