Soybean Complex Crushing & Stocks Update – Aug ’20
Executive Summary
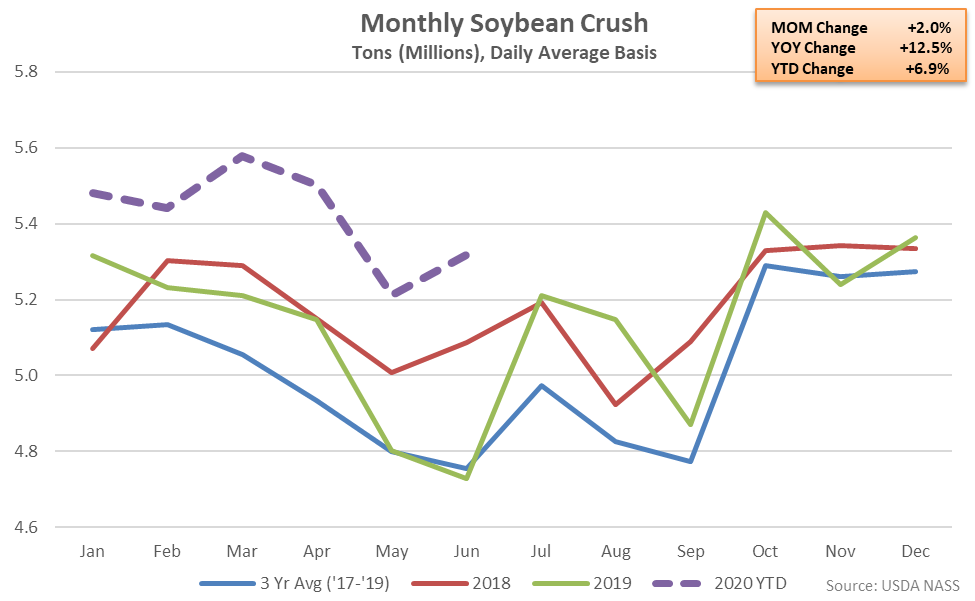
U.S. soybean crush and stocks figures provided by the USDA were recently updated with values spanning through Jun ’20. Highlights from the updated report include:
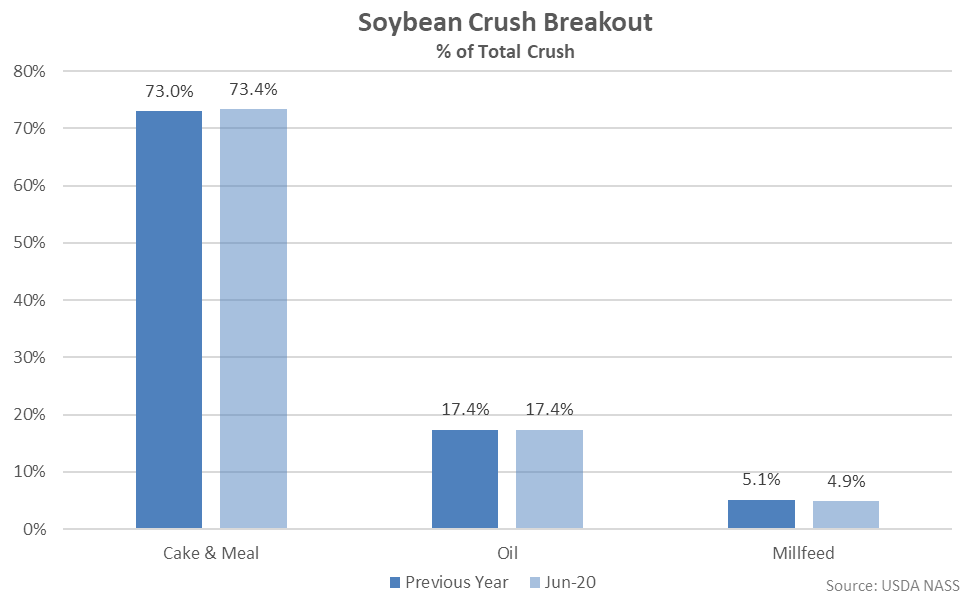
 Cake & meal accounted for 73.4% of the total soybean crush throughout Jun ’20, up slightly from the previous year, while oil accounted for 17.4% of the total soybean crush, consistent with the previous year.
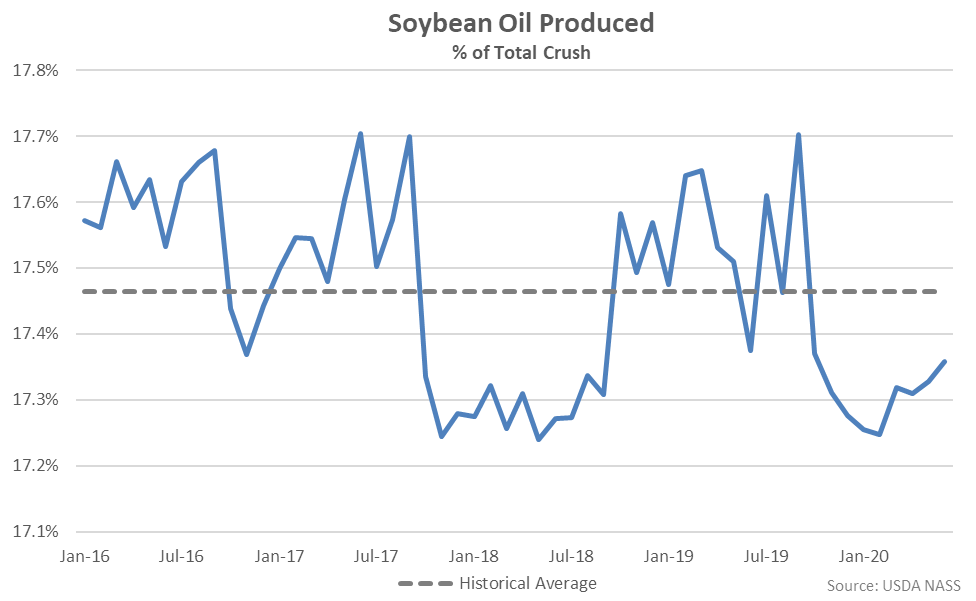
 Jun ’20 soybean oil produced as a percentage of total crush rebounded to an eight month high level but remained below historical average figures for the ninth consecutive month.
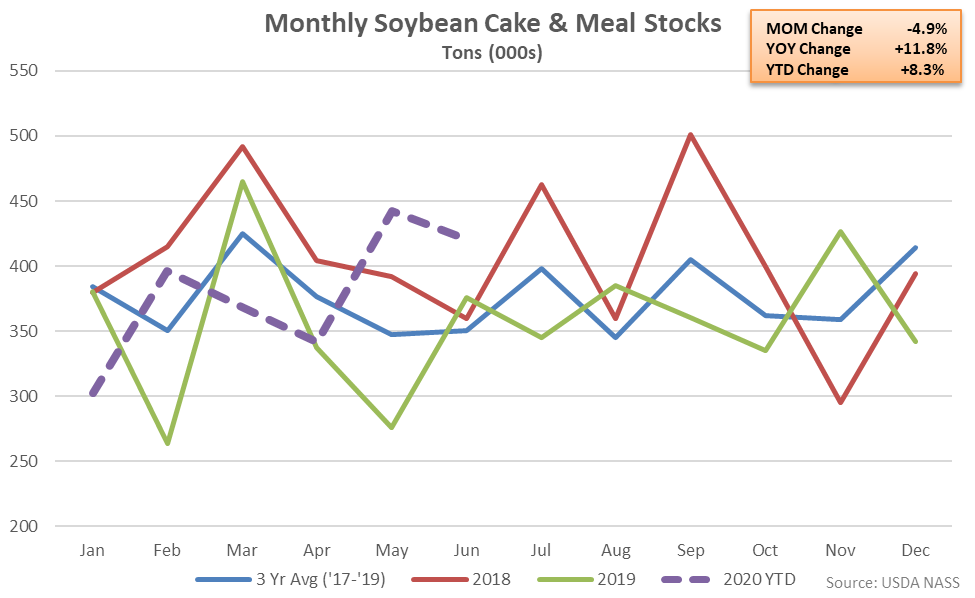
 Soybean Cake & Meal Stocks – Stocks Reach a Record High Seasonal Level, up 11.8% YOY
Jun ’20 U.S. soybean cake & meal stocks declined 4.9% from the 14 month high level experienced throughout the previous month but remained 11.8% above previous year levels. The YOY increase in soybean cake & meal stocks was the third experienced in a row. Soybean cake & meal stocks finished at a record high seasonal level for the month of June. The month-over-month decline in soybean cake & meal stocks of 4.9% was a contraseasonal move when compared to the three year average May – June seasonal increase in stocks of 4.0%, however. Jun ’20 soybean cake & meal stocks finished 20.0% above three year average seasonal levels, finishing higher for the second consecutive month.
Soybean Cake & Meal Stocks – Stocks Reach a Record High Seasonal Level, up 11.8% YOY
Jun ’20 U.S. soybean cake & meal stocks declined 4.9% from the 14 month high level experienced throughout the previous month but remained 11.8% above previous year levels. The YOY increase in soybean cake & meal stocks was the third experienced in a row. Soybean cake & meal stocks finished at a record high seasonal level for the month of June. The month-over-month decline in soybean cake & meal stocks of 4.9% was a contraseasonal move when compared to the three year average May – June seasonal increase in stocks of 4.0%, however. Jun ’20 soybean cake & meal stocks finished 20.0% above three year average seasonal levels, finishing higher for the second consecutive month.
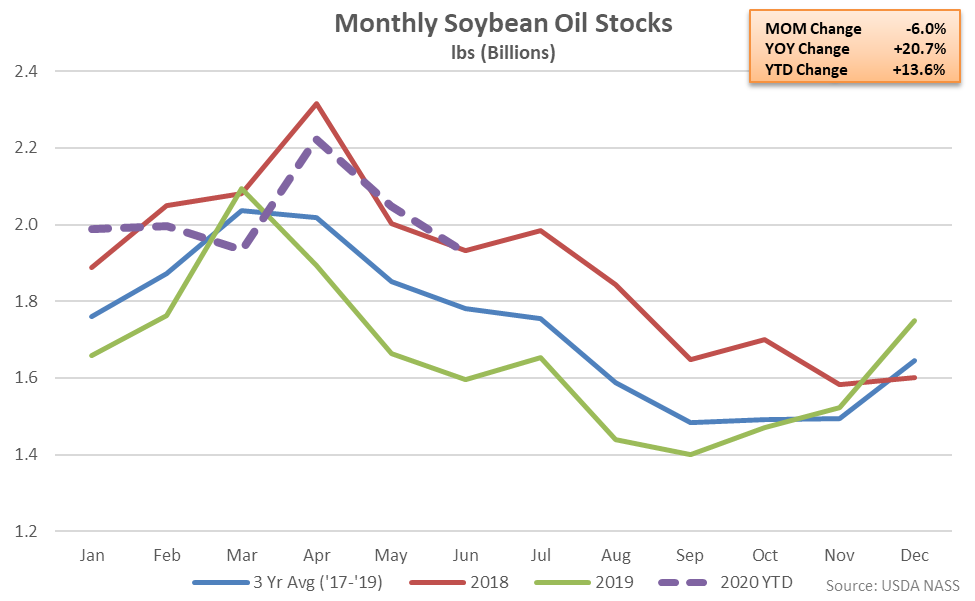
 Soybean Oil Stocks – Stocks Remain Higher YOY for the Sixth Time in Seven Months, up 20.7%
Jun ’20 U.S. soybean oil stocks declined 6.0% from the previous month, reaching a six month low level but remaining 20.7% above previous year volumes. Soybean oil stocks had finished lower on a YOY basis throughout eight consecutive months through Nov ’19 prior to finishing higher throughout six of the past seven months. The month-over-month decline in soybean oil stocks of 6.0% was larger than the three year average May – June seasonal decline of 3.8%. Jun ’20 soybean oil stocks finished 8.1% above three year average seasonal levels, finishing higher for the sixth time in the past seven months.
Soybean Oil Stocks – Stocks Remain Higher YOY for the Sixth Time in Seven Months, up 20.7%
Jun ’20 U.S. soybean oil stocks declined 6.0% from the previous month, reaching a six month low level but remaining 20.7% above previous year volumes. Soybean oil stocks had finished lower on a YOY basis throughout eight consecutive months through Nov ’19 prior to finishing higher throughout six of the past seven months. The month-over-month decline in soybean oil stocks of 6.0% was larger than the three year average May – June seasonal decline of 3.8%. Jun ’20 soybean oil stocks finished 8.1% above three year average seasonal levels, finishing higher for the sixth time in the past seven months.
- U.S. soybean crushings increased 12.5% on a YOY basis during Jun ’20, remaining at a record high seasonal level for the seventh consecutive month.
- U.S. soybean cake & meal stocks finished 11.8% higher on a YOY basis during Jun ’20, reaching a record high seasonal level.
- U.S. soybean oil stocks remained higher on a YOY basis for the sixth time in the past seven months, finishing up 20.7%.
Cake & meal accounted for 73.4% of the total soybean crush throughout Jun ’20, up slightly from the previous year, while oil accounted for 17.4% of the total soybean crush, consistent with the previous year.
Jun ’20 soybean oil produced as a percentage of total crush rebounded to an eight month high level but remained below historical average figures for the ninth consecutive month.
Soybean Cake & Meal Stocks – Stocks Reach a Record High Seasonal Level, up 11.8% YOY
Jun ’20 U.S. soybean cake & meal stocks declined 4.9% from the 14 month high level experienced throughout the previous month but remained 11.8% above previous year levels. The YOY increase in soybean cake & meal stocks was the third experienced in a row. Soybean cake & meal stocks finished at a record high seasonal level for the month of June. The month-over-month decline in soybean cake & meal stocks of 4.9% was a contraseasonal move when compared to the three year average May – June seasonal increase in stocks of 4.0%, however. Jun ’20 soybean cake & meal stocks finished 20.0% above three year average seasonal levels, finishing higher for the second consecutive month.
Soybean Oil Stocks – Stocks Remain Higher YOY for the Sixth Time in Seven Months, up 20.7%
Jun ’20 U.S. soybean oil stocks declined 6.0% from the previous month, reaching a six month low level but remaining 20.7% above previous year volumes. Soybean oil stocks had finished lower on a YOY basis throughout eight consecutive months through Nov ’19 prior to finishing higher throughout six of the past seven months. The month-over-month decline in soybean oil stocks of 6.0% was larger than the three year average May – June seasonal decline of 3.8%. Jun ’20 soybean oil stocks finished 8.1% above three year average seasonal levels, finishing higher for the sixth time in the past seven months.