Soybean Complex Crushing & Stocks Update – Jul ’20
Executive Summary
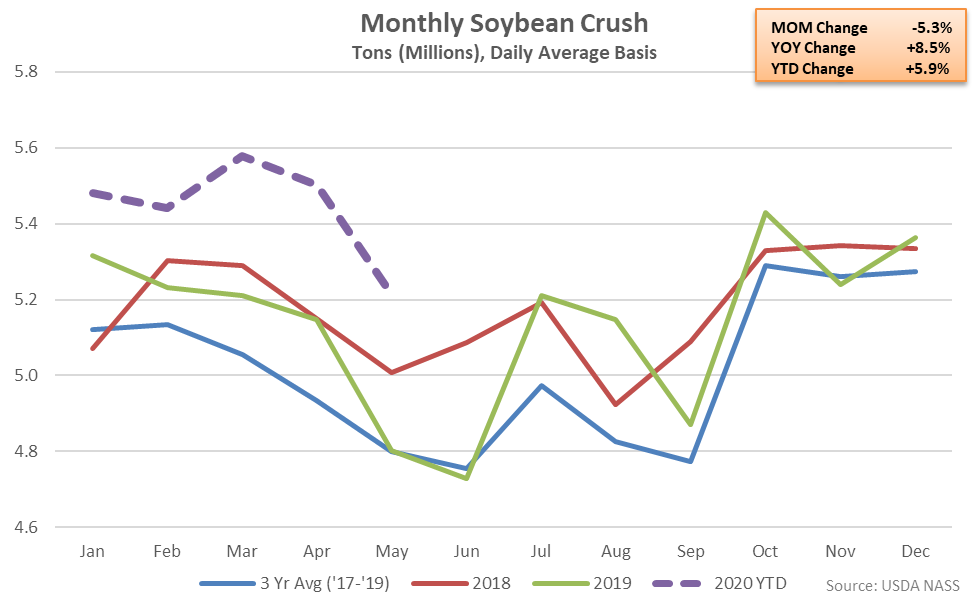
U.S. soybean crush and stocks figures provided by the USDA were recently updated with values spanning through May ’20. Highlights from the updated report include:
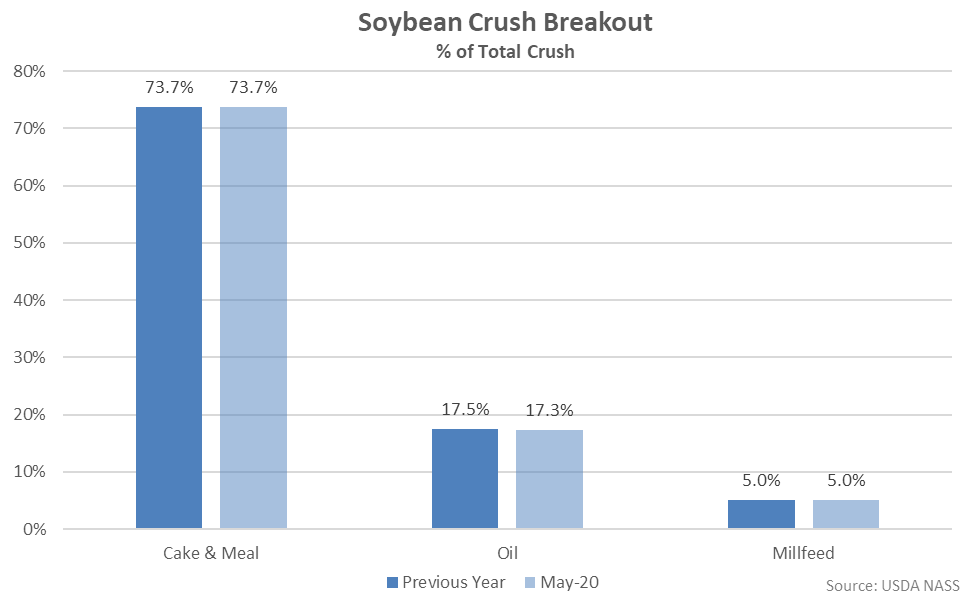
 Cake & meal accounted for 73.7% of the total soybean crush throughout May ’20, consistent with the previous year, while oil accounted for 17.3% of the total soybean crush, down slightly from the previous year.
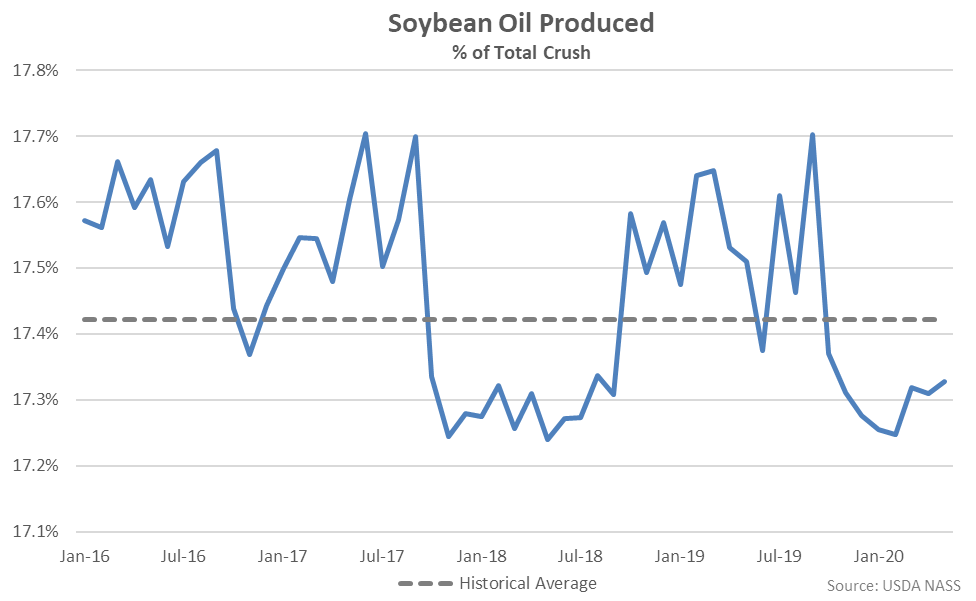
 May ’20 soybean oil produced as a percentage of total crush remained above recently experienced 21 month low levels but finished below historical average figures for the eighth consecutive month.
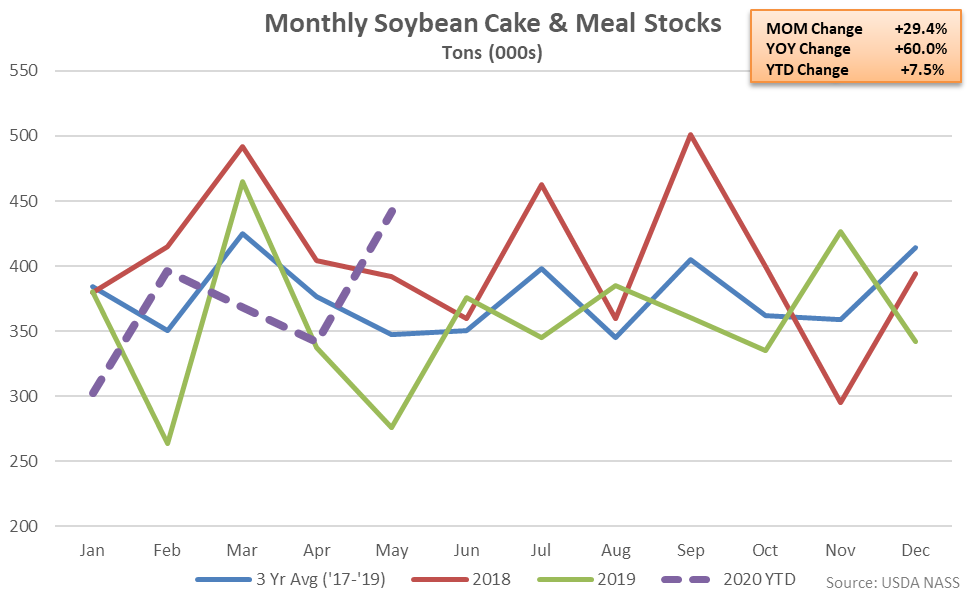
 Soybean Cake & Meal Stocks – Stocks Reach a 14 Month High Level, Finish up 60.0% YOY
May ’20 U.S. soybean cake & meal stocks increased 29.4% MOM, reaching a 14 month high level and finishing 60.0% above previous year levels. The YOY increase in soybean cake & meal stocks was the third experienced throughout the past four months. Soybean cake & meal stocks finished at a five year seasonal high level for the month of May. The month-over-month increase in soybean cake & meal stocks of 29.4% was a contraseasonal move when compared to the three year average April – May seasonal decline in stocks of 8.1%. May ’20 soybean cake & meal stocks finished 27.2% above three year average seasonal levels, finishing higher for the first time in the past three months.
Soybean Cake & Meal Stocks – Stocks Reach a 14 Month High Level, Finish up 60.0% YOY
May ’20 U.S. soybean cake & meal stocks increased 29.4% MOM, reaching a 14 month high level and finishing 60.0% above previous year levels. The YOY increase in soybean cake & meal stocks was the third experienced throughout the past four months. Soybean cake & meal stocks finished at a five year seasonal high level for the month of May. The month-over-month increase in soybean cake & meal stocks of 29.4% was a contraseasonal move when compared to the three year average April – May seasonal decline in stocks of 8.1%. May ’20 soybean cake & meal stocks finished 27.2% above three year average seasonal levels, finishing higher for the first time in the past three months.
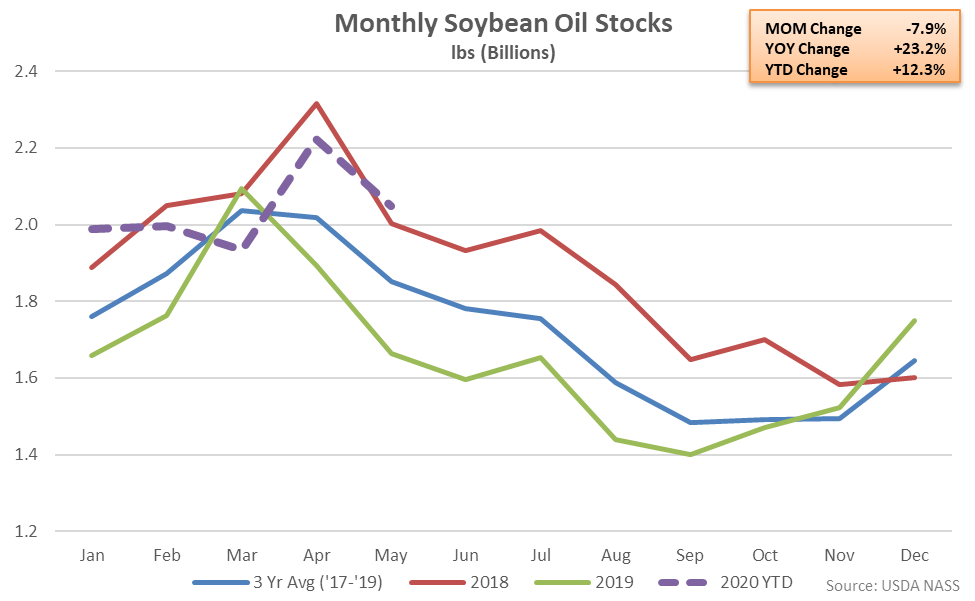
 Soybean Oil Stocks – Stocks Remain Higher on a YOY Basis for the Fifth Time in Six Months, up 23.2%
May ’20 U.S. soybean oil stocks declined 7.9% MOM from the two year high level experienced throughout the previous month but remained 23.2% above previous year volumes. Soybean oil stocks had finished lower on a YOY basis throughout eight consecutive months through Nov ’19 prior to finishing higher throughout five of the past six months. Soybean oil stocks finished at a four year seasonal high level for the month of May. The month-over-month decline in soybean oil stocks of 7.9% was consistent with the three year average April – May seasonal decline of 7.8%. May ’20 soybean oil stocks finished 10.7% above three year average seasonal levels, finishing higher for the fifth time in the past six months.
Soybean Oil Stocks – Stocks Remain Higher on a YOY Basis for the Fifth Time in Six Months, up 23.2%
May ’20 U.S. soybean oil stocks declined 7.9% MOM from the two year high level experienced throughout the previous month but remained 23.2% above previous year volumes. Soybean oil stocks had finished lower on a YOY basis throughout eight consecutive months through Nov ’19 prior to finishing higher throughout five of the past six months. Soybean oil stocks finished at a four year seasonal high level for the month of May. The month-over-month decline in soybean oil stocks of 7.9% was consistent with the three year average April – May seasonal decline of 7.8%. May ’20 soybean oil stocks finished 10.7% above three year average seasonal levels, finishing higher for the fifth time in the past six months.
- U.S. soybean crushings increased 8.5% on a YOY basis during May ’20, remaining at a record high seasonal level for the sixth consecutive month.
- U.S. soybean cake & meal stocks finished 60.0% higher on a YOY basis during May ’20, reaching a five year high seasonal level.
- U.S. soybean oil stocks finished 23.2% higher on a YOY basis during May ’20, reaching a four year high seasonal level.
Cake & meal accounted for 73.7% of the total soybean crush throughout May ’20, consistent with the previous year, while oil accounted for 17.3% of the total soybean crush, down slightly from the previous year.
May ’20 soybean oil produced as a percentage of total crush remained above recently experienced 21 month low levels but finished below historical average figures for the eighth consecutive month.
Soybean Cake & Meal Stocks – Stocks Reach a 14 Month High Level, Finish up 60.0% YOY
May ’20 U.S. soybean cake & meal stocks increased 29.4% MOM, reaching a 14 month high level and finishing 60.0% above previous year levels. The YOY increase in soybean cake & meal stocks was the third experienced throughout the past four months. Soybean cake & meal stocks finished at a five year seasonal high level for the month of May. The month-over-month increase in soybean cake & meal stocks of 29.4% was a contraseasonal move when compared to the three year average April – May seasonal decline in stocks of 8.1%. May ’20 soybean cake & meal stocks finished 27.2% above three year average seasonal levels, finishing higher for the first time in the past three months.
Soybean Oil Stocks – Stocks Remain Higher on a YOY Basis for the Fifth Time in Six Months, up 23.2%
May ’20 U.S. soybean oil stocks declined 7.9% MOM from the two year high level experienced throughout the previous month but remained 23.2% above previous year volumes. Soybean oil stocks had finished lower on a YOY basis throughout eight consecutive months through Nov ’19 prior to finishing higher throughout five of the past six months. Soybean oil stocks finished at a four year seasonal high level for the month of May. The month-over-month decline in soybean oil stocks of 7.9% was consistent with the three year average April – May seasonal decline of 7.8%. May ’20 soybean oil stocks finished 10.7% above three year average seasonal levels, finishing higher for the fifth time in the past six months.