Atten Babler Meat FX Indices – Jun ’20
The Atten Babler Commodities Meat Foreign Exchange (FX) Indices were mixed throughout May ’20. The USD/Meat Exporter FX Index and USD/Domestic Meat Importer FX Index increased to record high levels however the USD/Meat Importer FX Index declined from the record high level experienced throughout the previous month.
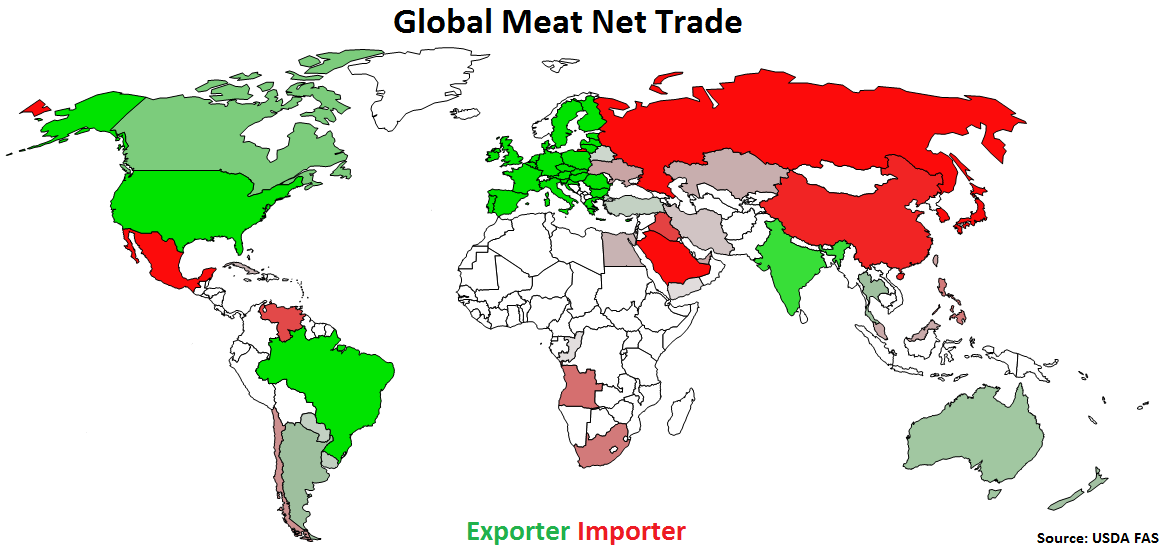
Global Meat Net Trade:
Major net meat exporters are led by the U.S., followed by Brazil, the EU-28, India, Canada and Australia (represented in green in the chart below). Major net meat importers are led by Japan, followed by Russia, Mexico, the U.S., China, the EU-28, Hong Kong and Saudi Arabia (represented in red in the chart below).
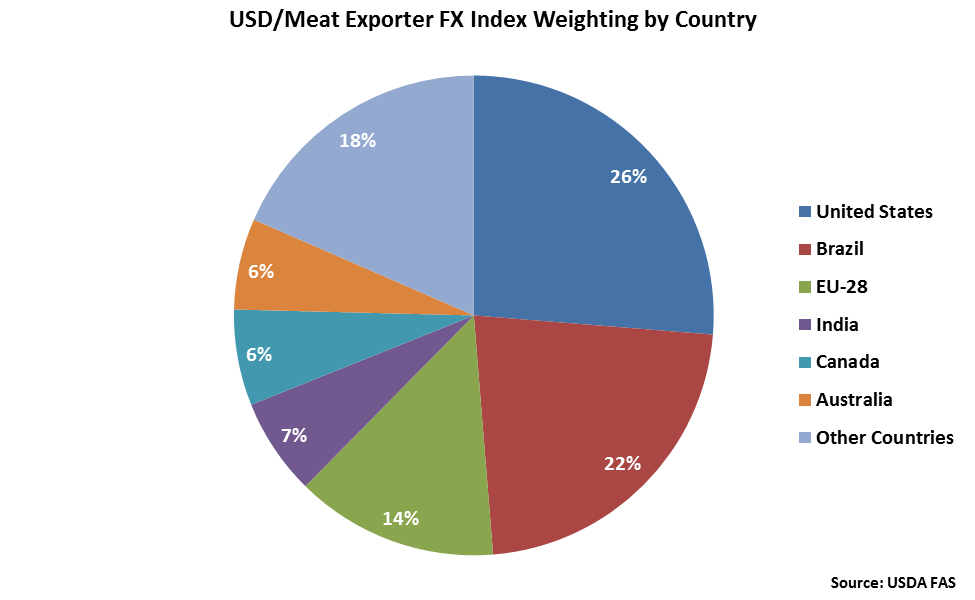
 The United States accounts for over a quarter of the USD/Meat Exporter FX Index, followed by Brazil at 22% and the EU-28 at 14%. India, Canada and Australia each account for between 5-10% of the index.
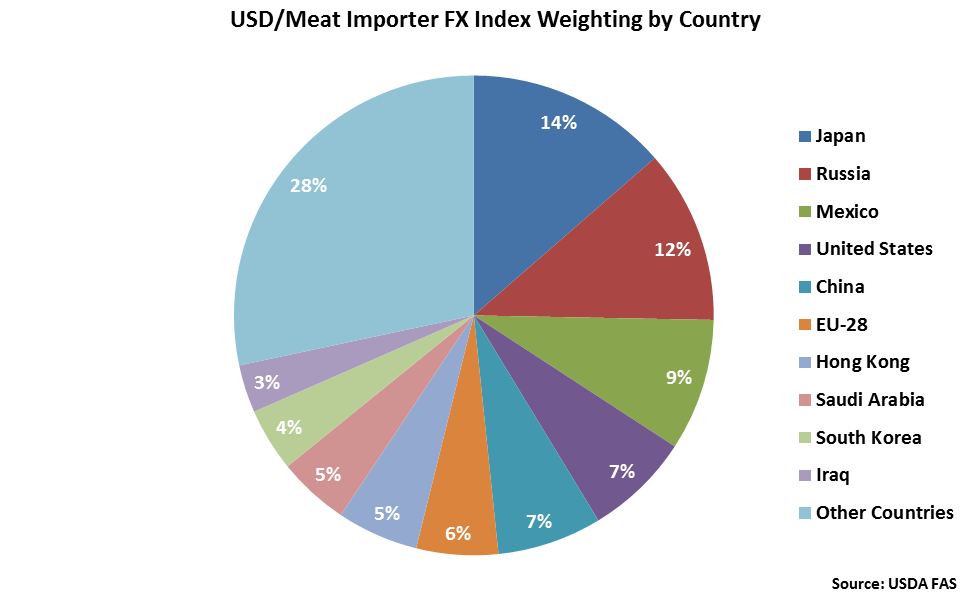
 Japan accounts for 14% of the USD/Meat Importer FX Index, followed by Russia at 12%. Mexico, the United States, China, the EU-28, Hong Kong and Saudi Arabia each account for between 5-10% of the index.
 USD/Meat Exporter FX Index:
The USD/Meat Exporter FX Index increased 6.5 points during May ’20, finishing at a record high value of 246.1. The USD/Meat Exporter FX Index has increased 46.7 points throughout the past six months and 214.2 points since the beginning of 2014. A strong USD/Meat Exporter FX Index reduces the competitiveness of U.S. meat relative to other exporting regions (represented in green in the Global Meat Net Trade chart), ultimately resulting in less foreign demand, all other factors being equal. USD appreciation against the Argentine peso has accounted for the majority of the gains since the beginning of 2014.
USD/Meat Exporter FX Index:
The USD/Meat Exporter FX Index increased 6.5 points during May ’20, finishing at a record high value of 246.1. The USD/Meat Exporter FX Index has increased 46.7 points throughout the past six months and 214.2 points since the beginning of 2014. A strong USD/Meat Exporter FX Index reduces the competitiveness of U.S. meat relative to other exporting regions (represented in green in the Global Meat Net Trade chart), ultimately resulting in less foreign demand, all other factors being equal. USD appreciation against the Argentine peso has accounted for the majority of the gains since the beginning of 2014.
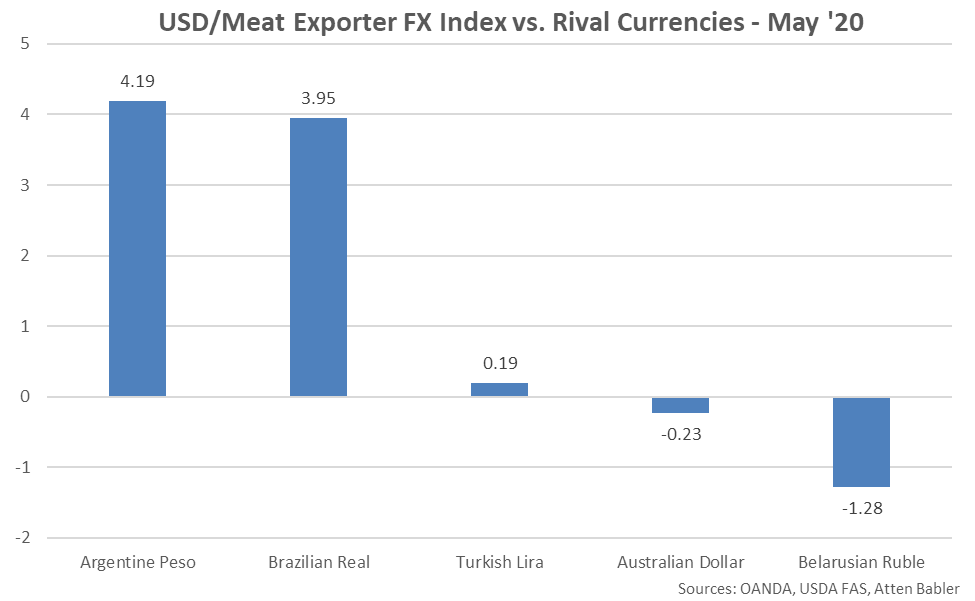
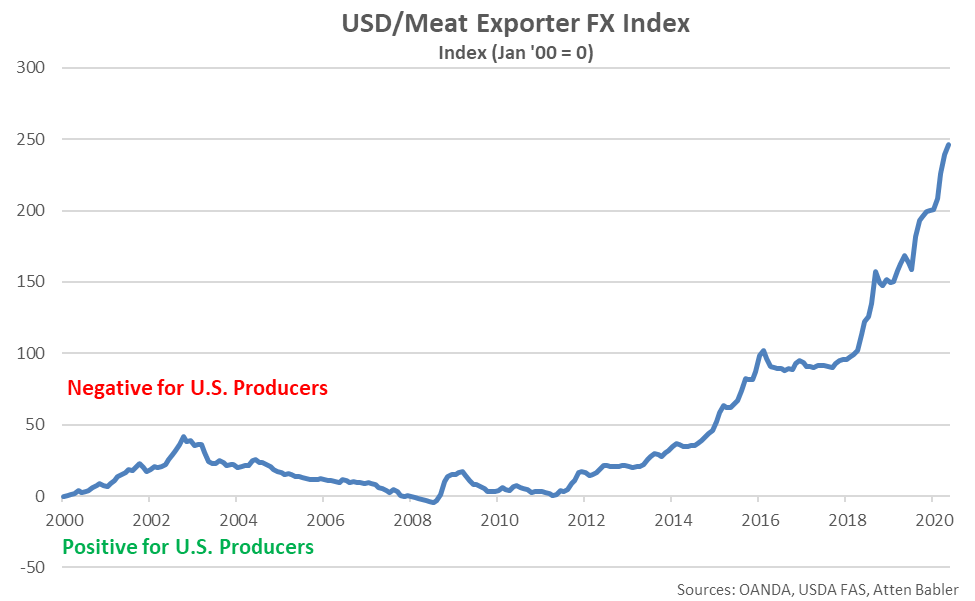 USD appreciation within the USD/Meat Exporter FX Index during May ’20 was led by gains against the Argentine peso, followed by gains against the Brazilian real and Turkish lira. USD declines were exhibited against the Belarusian ruble and Australian dollar.
 USD/Meat Importer FX Index:
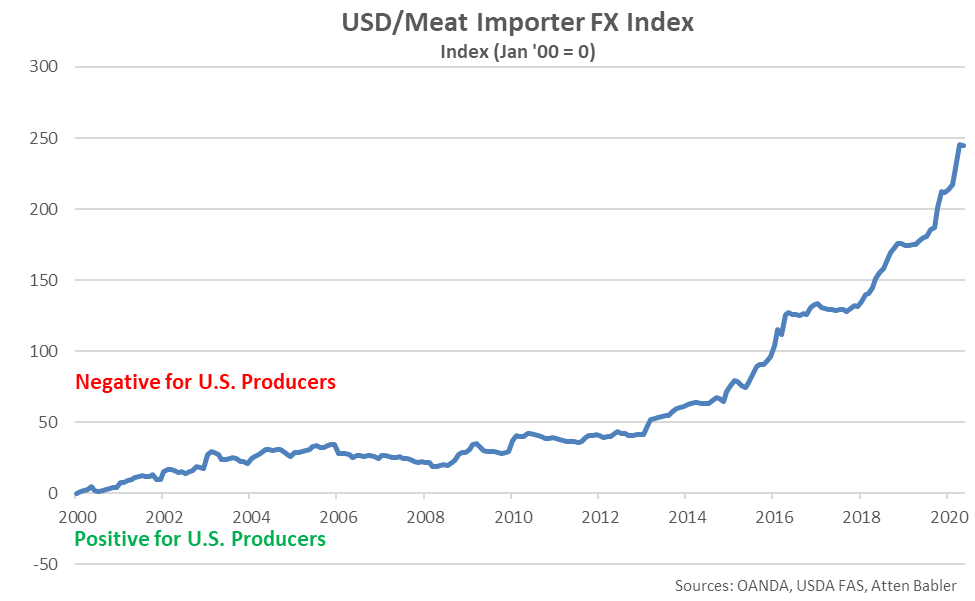
The USD/Meat Importer FX Index declined 0.4 points during May ’20, finishing at a value of 244.8. Despite declining from the previous month, the USD/Meat Importer FX Index remained at the second highest level on record. The USD/Meat Importer FX Index has increased 32.7 points throughout the past six months and 183.6 points since the beginning of 2014. A strong USD/Meat Importer FX Index results in less purchasing power for major meat importing countries (represented in red in the Global Meat Net Trade chart), making U.S. meat more expensive to import. USD appreciation against the Angolan kwanza has accounted for the majority of the gains since the beginning of 2014.
USD/Meat Importer FX Index:
The USD/Meat Importer FX Index declined 0.4 points during May ’20, finishing at a value of 244.8. Despite declining from the previous month, the USD/Meat Importer FX Index remained at the second highest level on record. The USD/Meat Importer FX Index has increased 32.7 points throughout the past six months and 183.6 points since the beginning of 2014. A strong USD/Meat Importer FX Index results in less purchasing power for major meat importing countries (represented in red in the Global Meat Net Trade chart), making U.S. meat more expensive to import. USD appreciation against the Angolan kwanza has accounted for the majority of the gains since the beginning of 2014.
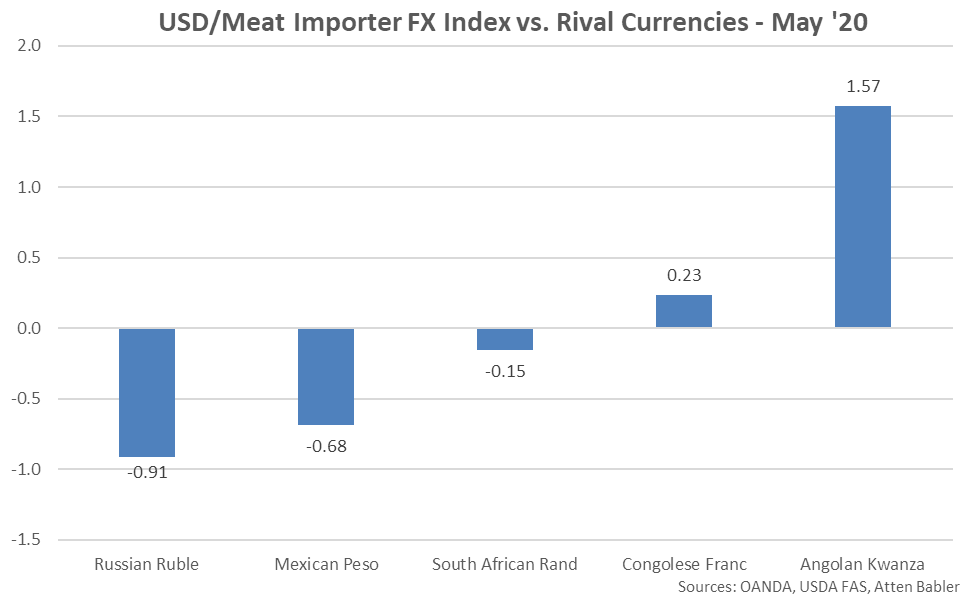
 Appreciation against the USD within the USD/Meat Importer FX Index during May ’20 was led by gains by the Russian ruble, followed by gains by the Mexican peso and South African rand. USD gains were exhibited against the Angolan kwanza and Congolese franc.
 U.S. Meat Export Destinations:
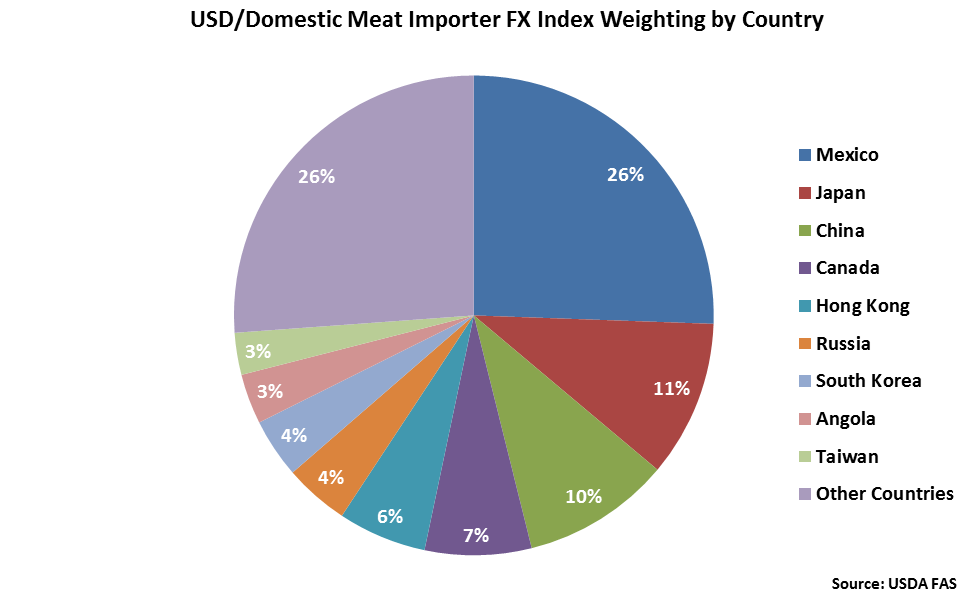
Major destinations for U.S. meat exports are led by Mexico, followed by Japan, China, Canada, and Hong Kong.
U.S. Meat Export Destinations:
Major destinations for U.S. meat exports are led by Mexico, followed by Japan, China, Canada, and Hong Kong.
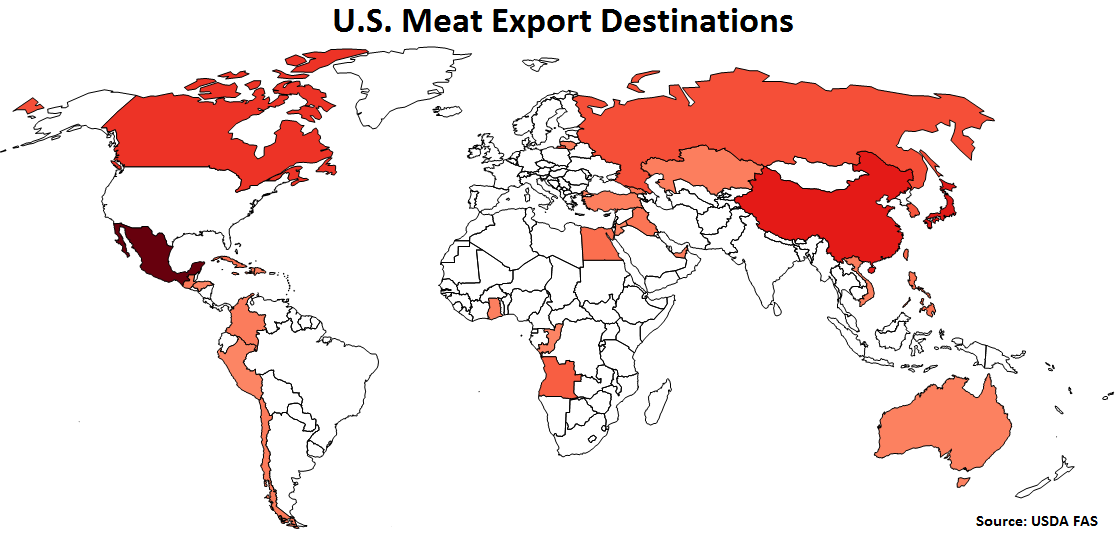 Mexico accounts for over a quarter of the USD/Domestic Meat Importer FX Index, followed by Japan at 11%. China, Canada and Hong Kong each account for between 5-10% of the index.
 USD/Domestic Meat Importer FX Index:
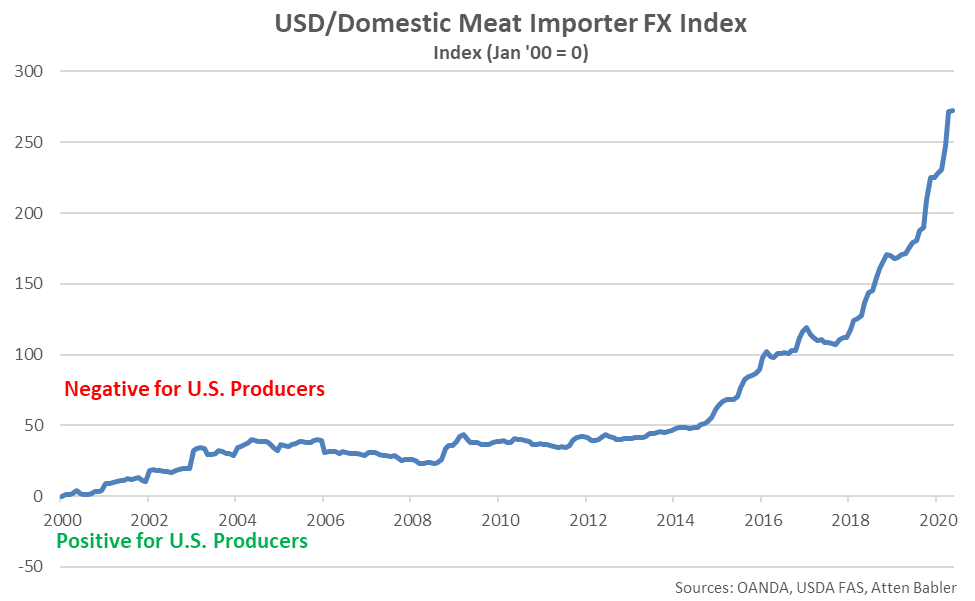
The USD/Domestic Meat Importer FX Index increased 0.4 points during May ’20, finishing at a record high value of 272.4. The USD/Domestic Meat Importer FX Index has increased 47.7 points throughout the past six months and 226.0 points since the beginning of 2014. A strong USD/Domestic Meat Importer FX Index results in less purchasing power for the traditional buyers of U.S. meat (represented in red in the U.S. Meat Export Destinations chart), ultimately resulting in less foreign demand, all other factors being equal. USD appreciation against the Angolan kwanza has accounted for the majority of the gains since the beginning of 2014.
USD/Domestic Meat Importer FX Index:
The USD/Domestic Meat Importer FX Index increased 0.4 points during May ’20, finishing at a record high value of 272.4. The USD/Domestic Meat Importer FX Index has increased 47.7 points throughout the past six months and 226.0 points since the beginning of 2014. A strong USD/Domestic Meat Importer FX Index results in less purchasing power for the traditional buyers of U.S. meat (represented in red in the U.S. Meat Export Destinations chart), ultimately resulting in less foreign demand, all other factors being equal. USD appreciation against the Angolan kwanza has accounted for the majority of the gains since the beginning of 2014.
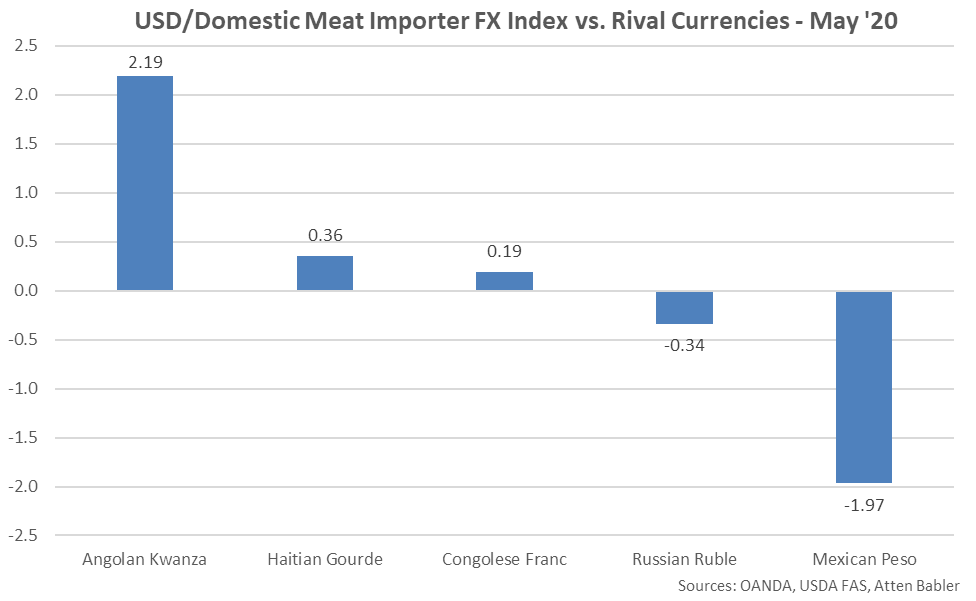
 USD appreciation within the USD/Domestic Meat Importer FX Index during May ’20 was led by gains against the Angolan kwanza, followed by gains against the Haitian gourde and Congolese franc. USD declines were exhibited against the Mexican peso and Russian ruble.
The United States accounts for over a quarter of the USD/Meat Exporter FX Index, followed by Brazil at 22% and the EU-28 at 14%. India, Canada and Australia each account for between 5-10% of the index.
Japan accounts for 14% of the USD/Meat Importer FX Index, followed by Russia at 12%. Mexico, the United States, China, the EU-28, Hong Kong and Saudi Arabia each account for between 5-10% of the index.
USD/Meat Exporter FX Index:
The USD/Meat Exporter FX Index increased 6.5 points during May ’20, finishing at a record high value of 246.1. The USD/Meat Exporter FX Index has increased 46.7 points throughout the past six months and 214.2 points since the beginning of 2014. A strong USD/Meat Exporter FX Index reduces the competitiveness of U.S. meat relative to other exporting regions (represented in green in the Global Meat Net Trade chart), ultimately resulting in less foreign demand, all other factors being equal. USD appreciation against the Argentine peso has accounted for the majority of the gains since the beginning of 2014.
USD appreciation within the USD/Meat Exporter FX Index during May ’20 was led by gains against the Argentine peso, followed by gains against the Brazilian real and Turkish lira. USD declines were exhibited against the Belarusian ruble and Australian dollar.
USD/Meat Importer FX Index:
The USD/Meat Importer FX Index declined 0.4 points during May ’20, finishing at a value of 244.8. Despite declining from the previous month, the USD/Meat Importer FX Index remained at the second highest level on record. The USD/Meat Importer FX Index has increased 32.7 points throughout the past six months and 183.6 points since the beginning of 2014. A strong USD/Meat Importer FX Index results in less purchasing power for major meat importing countries (represented in red in the Global Meat Net Trade chart), making U.S. meat more expensive to import. USD appreciation against the Angolan kwanza has accounted for the majority of the gains since the beginning of 2014.
Appreciation against the USD within the USD/Meat Importer FX Index during May ’20 was led by gains by the Russian ruble, followed by gains by the Mexican peso and South African rand. USD gains were exhibited against the Angolan kwanza and Congolese franc.
U.S. Meat Export Destinations:
Major destinations for U.S. meat exports are led by Mexico, followed by Japan, China, Canada, and Hong Kong.
Mexico accounts for over a quarter of the USD/Domestic Meat Importer FX Index, followed by Japan at 11%. China, Canada and Hong Kong each account for between 5-10% of the index.
USD/Domestic Meat Importer FX Index:
The USD/Domestic Meat Importer FX Index increased 0.4 points during May ’20, finishing at a record high value of 272.4. The USD/Domestic Meat Importer FX Index has increased 47.7 points throughout the past six months and 226.0 points since the beginning of 2014. A strong USD/Domestic Meat Importer FX Index results in less purchasing power for the traditional buyers of U.S. meat (represented in red in the U.S. Meat Export Destinations chart), ultimately resulting in less foreign demand, all other factors being equal. USD appreciation against the Angolan kwanza has accounted for the majority of the gains since the beginning of 2014.
USD appreciation within the USD/Domestic Meat Importer FX Index during May ’20 was led by gains against the Angolan kwanza, followed by gains against the Haitian gourde and Congolese franc. USD declines were exhibited against the Mexican peso and Russian ruble.