U.S. Dairy Product Production Update – Oct ’19
Executive Summary
U.S. dairy product production figures provided by USDA were recently updated with values spanning through Aug ’19. Highlights from the updated report include:
 Cheese – Production Remains at a Record High Seasonal Level, Finishes up 2.2% YOY
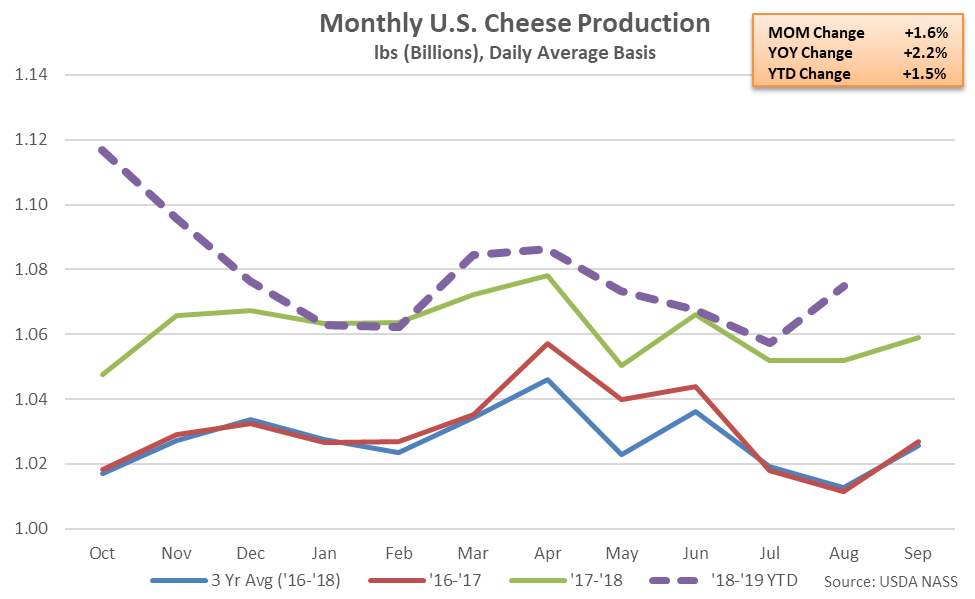
Aug ’19 total U.S. cheese production increased 1.6% MOM and 2.2% YOY, reaching a record high seasonal level for the month of August. The YOY increase in cheese production was the sixth experienced in a row. Aug ’19 Western and Central U.S. cheese production increased 3.8% and 1.5%, respectively, on a YOY basis throughout the month, more than offsetting a 0.7% YOY decline in Western U.S. cheese production. Cheddar cheese production increased 3.3% on a YOY basis throughout the month, while other-than-cheddar cheese production increased 1.7%.
’17-’18 annual cheese production increased 3.0% YOY to a record annual high as cheddar cheese production finished 2.7% higher and other-than-cheddar cheese increased 3.1%. ’18-’19 YTD cheese production has increased an additional 1.5% YOY heading into the final month of the production season, driven higher by a 2.5% increase in other-than-cheddar production.
Cheese – Production Remains at a Record High Seasonal Level, Finishes up 2.2% YOY
Aug ’19 total U.S. cheese production increased 1.6% MOM and 2.2% YOY, reaching a record high seasonal level for the month of August. The YOY increase in cheese production was the sixth experienced in a row. Aug ’19 Western and Central U.S. cheese production increased 3.8% and 1.5%, respectively, on a YOY basis throughout the month, more than offsetting a 0.7% YOY decline in Western U.S. cheese production. Cheddar cheese production increased 3.3% on a YOY basis throughout the month, while other-than-cheddar cheese production increased 1.7%.
’17-’18 annual cheese production increased 3.0% YOY to a record annual high as cheddar cheese production finished 2.7% higher and other-than-cheddar cheese increased 3.1%. ’18-’19 YTD cheese production has increased an additional 1.5% YOY heading into the final month of the production season, driven higher by a 2.5% increase in other-than-cheddar production.
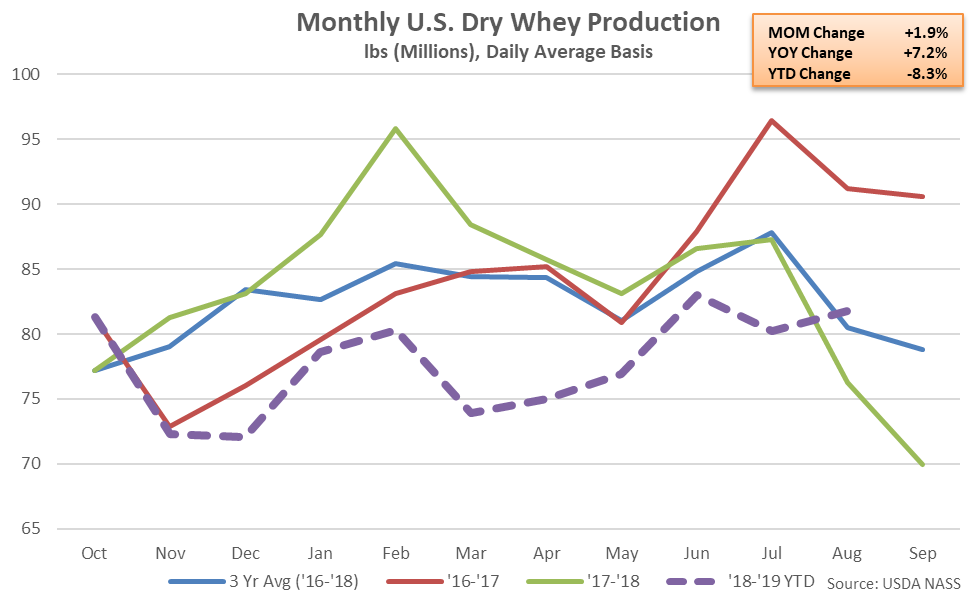
 Dry Whey – Production Increases YOY for the First Time in the Past Ten Months, Finishes up 7.2%
Aug ’19 U.S. dry whey production increased 1.9% MOM and 7.2% YOY, finishing higher on a YOY basis for the first time in the past ten months. Aug ’19 YOY increases in dry whey production were widespread regionally and led by the Western U.S. (+12.3%), followed by the Central U.S. (+9.2%) and the Atlantic U.S. (+0.1%).
Combined whey protein concentrate (WPC) and whey protein isolate (WPI) production remained lower on a YOY basis for the seventh consecutive month during Aug ’19, however, finishing down 7.0%. The YOY increase in dry whey production more than offset the YOY declines in WPC and WPI production experienced throughout Aug ’19, resulting in combined production increasing by 1.6%.
’17-’18 annual dry whey production declined 0.7% YOY however combined production of dry whey, WPC and WPI finished up 1.3%. ’18-’19 YTD dry whey production remains down an additional 8.3% YOY heading into the final month of the production season, despite the most recent YOY increase, while combined production of dry whey, WPC and WPI has declined 6.1%.
Dry Whey – Production Increases YOY for the First Time in the Past Ten Months, Finishes up 7.2%
Aug ’19 U.S. dry whey production increased 1.9% MOM and 7.2% YOY, finishing higher on a YOY basis for the first time in the past ten months. Aug ’19 YOY increases in dry whey production were widespread regionally and led by the Western U.S. (+12.3%), followed by the Central U.S. (+9.2%) and the Atlantic U.S. (+0.1%).
Combined whey protein concentrate (WPC) and whey protein isolate (WPI) production remained lower on a YOY basis for the seventh consecutive month during Aug ’19, however, finishing down 7.0%. The YOY increase in dry whey production more than offset the YOY declines in WPC and WPI production experienced throughout Aug ’19, resulting in combined production increasing by 1.6%.
’17-’18 annual dry whey production declined 0.7% YOY however combined production of dry whey, WPC and WPI finished up 1.3%. ’18-’19 YTD dry whey production remains down an additional 8.3% YOY heading into the final month of the production season, despite the most recent YOY increase, while combined production of dry whey, WPC and WPI has declined 6.1%.
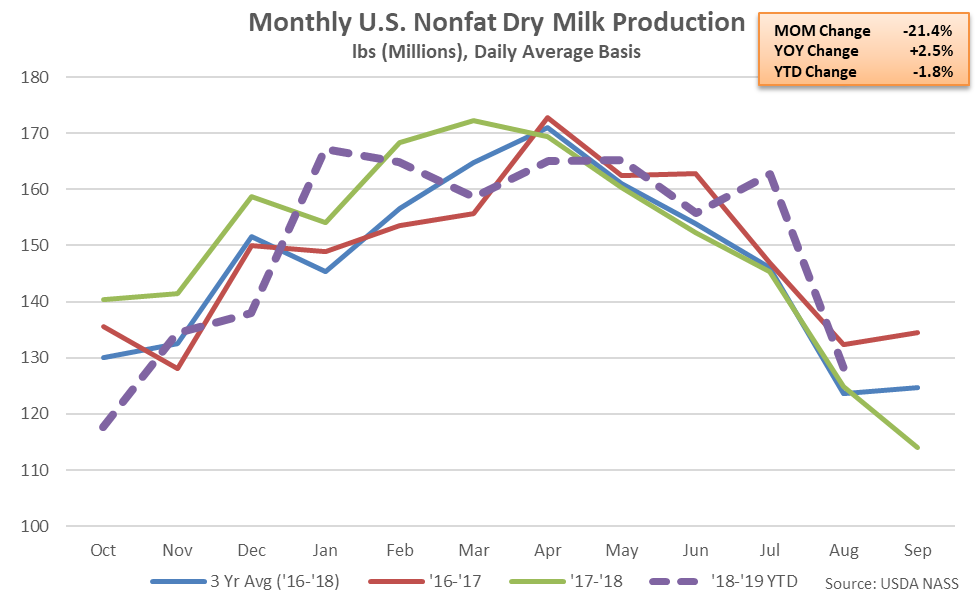
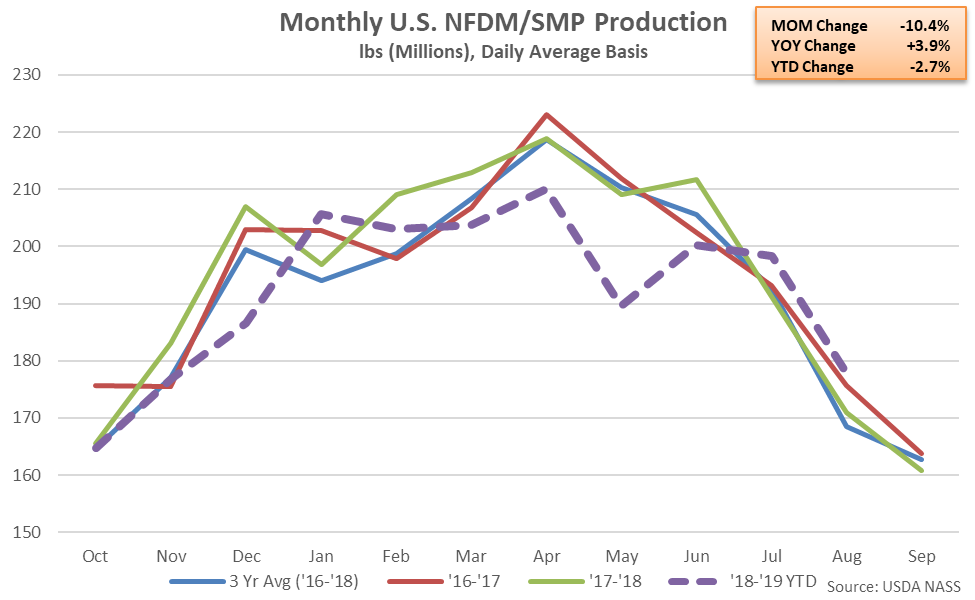
 NFDM/SMP – Combined Production Higher YOY for the Second Consecutive Month, Finishes up 3.9%
Aug ’19 U.S. nonfat dry milk (NFDM) production declined seasonally to a ten month low level but remained higher on a YOY basis for the fourth consecutive month, finishing up 2.5%. Aug ’19 YOY increases in Central U.S. (+23.8%) and Atlantic U.S. (+2.8) NFDM production more than offset a 4.8% YOY decline in Western U.S. production experienced throughout the month.
Production of skim milk powder (SMP), which is more suited to the requirements of most global markets, finished higher on a YOY basis for the first time in the past five months during Aug ’19, increasing by 8.0%. NFDM and SMP production had not each finished higher on a YOY basis within the same month over 26 consecutive months prior to Aug ’19. Aug ’19 combined production of NFDM and SMP increased 3.9% on a YOY basis, finishing higher for the second consecutive month.
’17-’18 annual combined production of NFDM and SMP increased 0.2% to a record high annual level however ’18-’19 YTD combined production of NFDM and SMP remains down 2.7% YOY heading into the final month of the production season, despite the recently experienced YOY increases.
NFDM/SMP – Combined Production Higher YOY for the Second Consecutive Month, Finishes up 3.9%
Aug ’19 U.S. nonfat dry milk (NFDM) production declined seasonally to a ten month low level but remained higher on a YOY basis for the fourth consecutive month, finishing up 2.5%. Aug ’19 YOY increases in Central U.S. (+23.8%) and Atlantic U.S. (+2.8) NFDM production more than offset a 4.8% YOY decline in Western U.S. production experienced throughout the month.
Production of skim milk powder (SMP), which is more suited to the requirements of most global markets, finished higher on a YOY basis for the first time in the past five months during Aug ’19, increasing by 8.0%. NFDM and SMP production had not each finished higher on a YOY basis within the same month over 26 consecutive months prior to Aug ’19. Aug ’19 combined production of NFDM and SMP increased 3.9% on a YOY basis, finishing higher for the second consecutive month.
’17-’18 annual combined production of NFDM and SMP increased 0.2% to a record high annual level however ’18-’19 YTD combined production of NFDM and SMP remains down 2.7% YOY heading into the final month of the production season, despite the recently experienced YOY increases.
 Overall, skim milk powder production increased most significantly YOY on a percentage basis during Aug ’19, followed by dry whey production. Other-than-cheddar cheese experienced the smallest YOY increase in production on a percentage basis throughout the month, followed by butter.
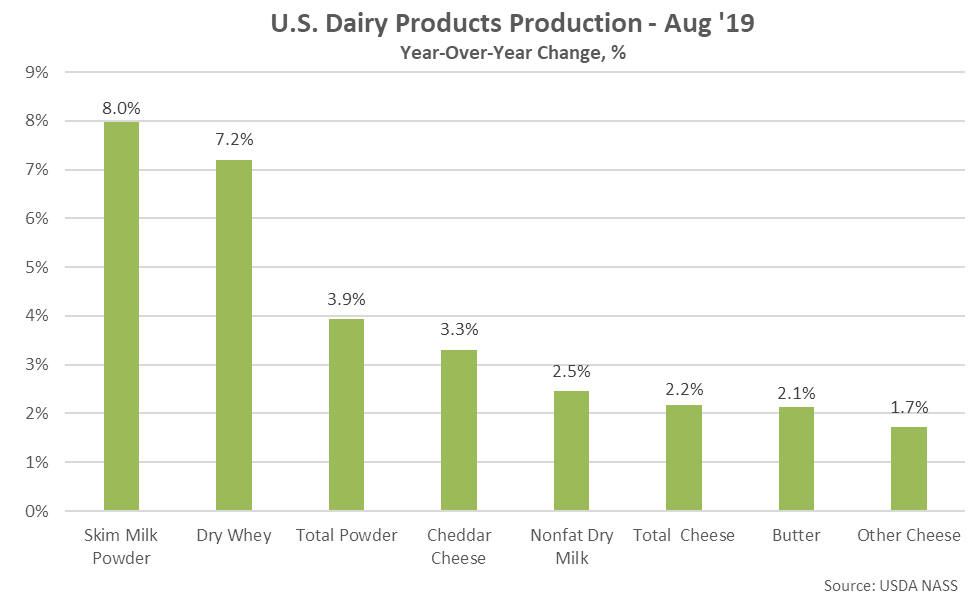
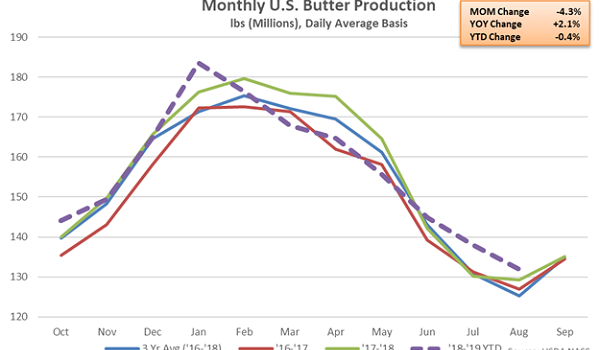
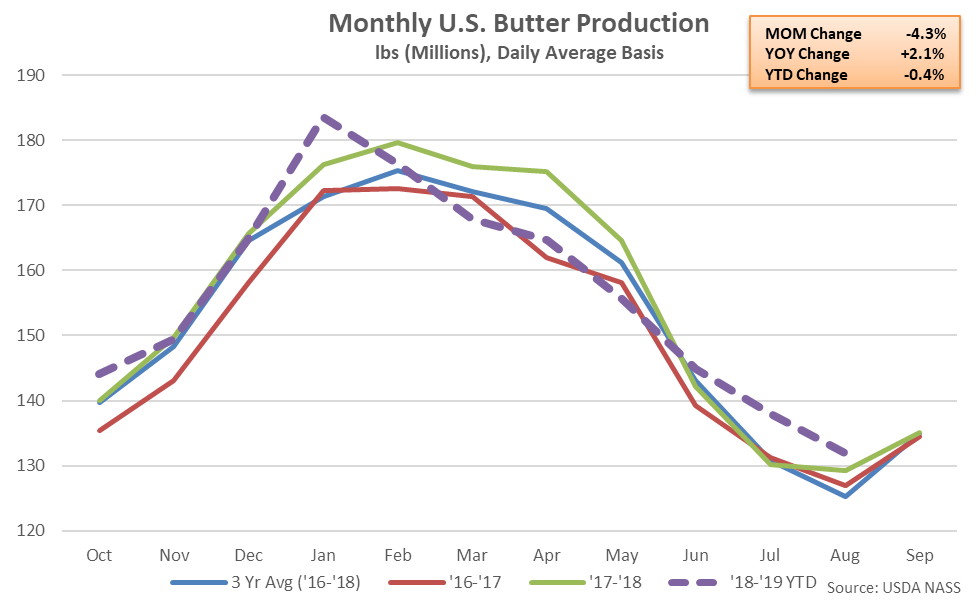
- Aug ’19 U.S. butter production increased on a YOY basis for the third consecutive month, finishing up 2.1% and reaching a record high seasonal level.
- Aug ’19 U.S. cheese production increased 2.2% YOY to a record high seasonal level while U.S. dry whey production finished higher on a YOY basis for the first time in the past ten months, finishing up 7.2%
- Aug ’19 combined production of U.S. nonfat dry milk and skim milk powder increased 3.9% on a YOY basis, finishing higher for the second consecutive month. Nonfat dry milk production increased 2.5% YOY throughout the month while skim milk powder production increased 8.0% YOY.
Cheese – Production Remains at a Record High Seasonal Level, Finishes up 2.2% YOY
Aug ’19 total U.S. cheese production increased 1.6% MOM and 2.2% YOY, reaching a record high seasonal level for the month of August. The YOY increase in cheese production was the sixth experienced in a row. Aug ’19 Western and Central U.S. cheese production increased 3.8% and 1.5%, respectively, on a YOY basis throughout the month, more than offsetting a 0.7% YOY decline in Western U.S. cheese production. Cheddar cheese production increased 3.3% on a YOY basis throughout the month, while other-than-cheddar cheese production increased 1.7%.
’17-’18 annual cheese production increased 3.0% YOY to a record annual high as cheddar cheese production finished 2.7% higher and other-than-cheddar cheese increased 3.1%. ’18-’19 YTD cheese production has increased an additional 1.5% YOY heading into the final month of the production season, driven higher by a 2.5% increase in other-than-cheddar production.
Dry Whey – Production Increases YOY for the First Time in the Past Ten Months, Finishes up 7.2%
Aug ’19 U.S. dry whey production increased 1.9% MOM and 7.2% YOY, finishing higher on a YOY basis for the first time in the past ten months. Aug ’19 YOY increases in dry whey production were widespread regionally and led by the Western U.S. (+12.3%), followed by the Central U.S. (+9.2%) and the Atlantic U.S. (+0.1%).
Combined whey protein concentrate (WPC) and whey protein isolate (WPI) production remained lower on a YOY basis for the seventh consecutive month during Aug ’19, however, finishing down 7.0%. The YOY increase in dry whey production more than offset the YOY declines in WPC and WPI production experienced throughout Aug ’19, resulting in combined production increasing by 1.6%.
’17-’18 annual dry whey production declined 0.7% YOY however combined production of dry whey, WPC and WPI finished up 1.3%. ’18-’19 YTD dry whey production remains down an additional 8.3% YOY heading into the final month of the production season, despite the most recent YOY increase, while combined production of dry whey, WPC and WPI has declined 6.1%.
NFDM/SMP – Combined Production Higher YOY for the Second Consecutive Month, Finishes up 3.9%
Aug ’19 U.S. nonfat dry milk (NFDM) production declined seasonally to a ten month low level but remained higher on a YOY basis for the fourth consecutive month, finishing up 2.5%. Aug ’19 YOY increases in Central U.S. (+23.8%) and Atlantic U.S. (+2.8) NFDM production more than offset a 4.8% YOY decline in Western U.S. production experienced throughout the month.
Production of skim milk powder (SMP), which is more suited to the requirements of most global markets, finished higher on a YOY basis for the first time in the past five months during Aug ’19, increasing by 8.0%. NFDM and SMP production had not each finished higher on a YOY basis within the same month over 26 consecutive months prior to Aug ’19. Aug ’19 combined production of NFDM and SMP increased 3.9% on a YOY basis, finishing higher for the second consecutive month.
’17-’18 annual combined production of NFDM and SMP increased 0.2% to a record high annual level however ’18-’19 YTD combined production of NFDM and SMP remains down 2.7% YOY heading into the final month of the production season, despite the recently experienced YOY increases.
Overall, skim milk powder production increased most significantly YOY on a percentage basis during Aug ’19, followed by dry whey production. Other-than-cheddar cheese experienced the smallest YOY increase in production on a percentage basis throughout the month, followed by butter.