U.S. Milk Production Update – Apr ’15
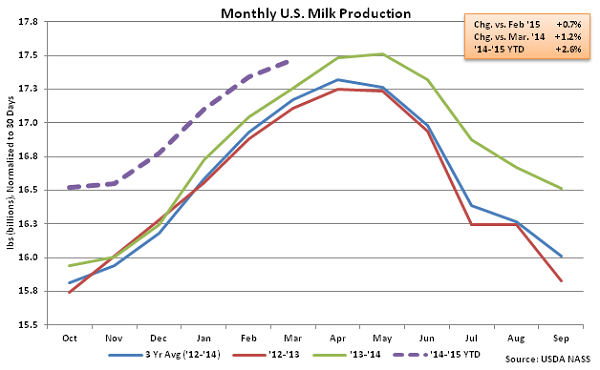
According to USDA, Mar ’15 U.S. milk production was up 1.2% YOY, at 18,050 million pounds, setting a new March production record. Production also increased MOM, up 0.7% on a daily average basis vs. Feb ’15 figures as production continues to build seasonally. The Mar ’15 seasonal build was less than half of the ten year average February – March increase in production of 1.5%.
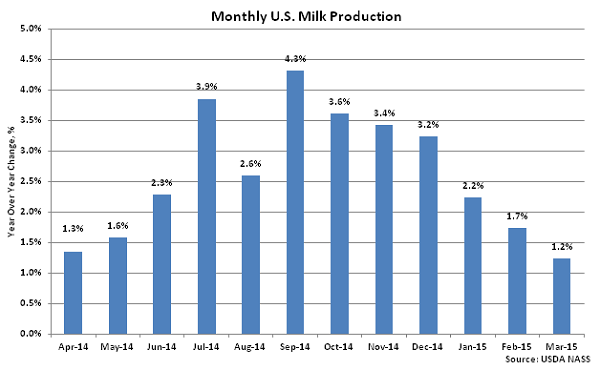
 U.S. milk production gains accelerated on a YOY basis throughout much of 2014, as shown below, however production growth tapered off over the final quarter of the year and into 2015. YOY production growth fell for the sixth consecutive month in Mar ’15 and remained at levels below the 2014 calendar year average YOY growth rate of 2.4%.
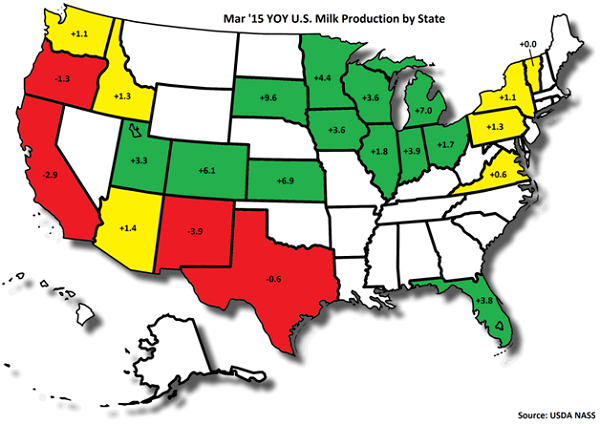
 YOY production gains on a percentage basis were led by South Dakota (+9.6%), Michigan (+7.0%) and Kansas (+6.9%). California milk production declined YOY for the fourth consecutive month, finishing 2.9% lower, while production in New Mexico, Oregon and Texas also finished lower than the prior year. California, New Mexico, Oregon and Texas experienced lower YOY milk per cow yields while California also experienced a reduction in their milk cow herd.
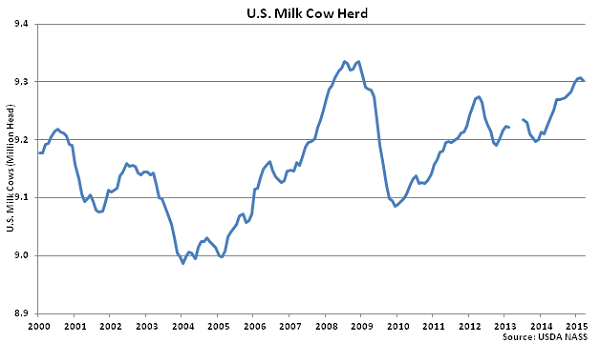
 Overall, the U.S. milk cow herd declined MOM for only the second time in the last 17 months in Mar ’15, with the number of milk cows on farms decreasing by 5,000 head vs. the Feb ’15 revised figure. The total milk cow herd stands at 9,301,000 head, which remains 78,000 head more than March of last year. Milk per cow yield was up 0.4% YOY, increasing to 1,941 lbs.
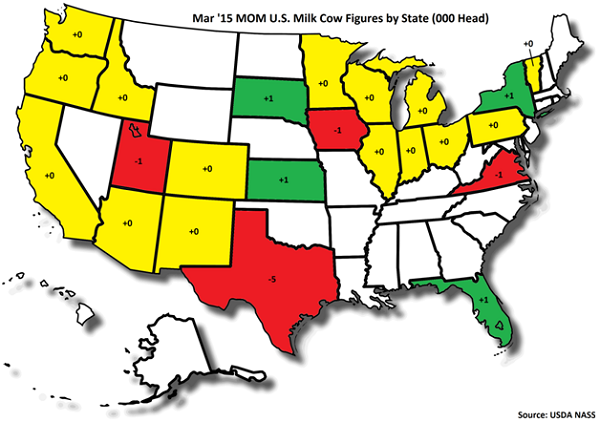
 The vast majority of the MOM decline in the milk cow herd occurred in Texas (-5,000 head), while the milk cow herds in Utah (-1,000 head), Iowa (-1,000 head) and Virginia (-1,000 head) also declining. MOM increases in milk cow herds were experienced in South Dakota (+1,000 head), Kansas (+1,000 head) and New York (+1,000 head).
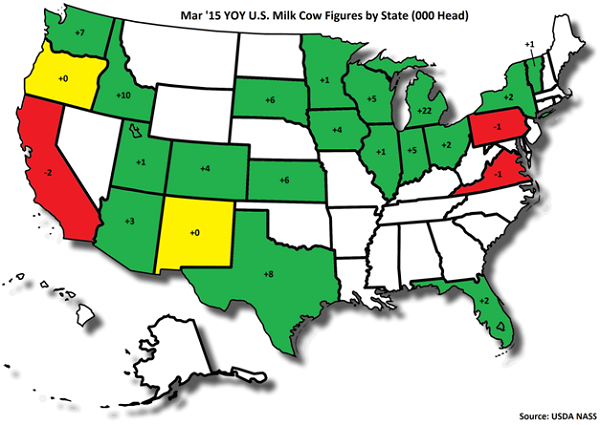
 YOY increases in milk cow herds were led by Michigan (+22,000 head), followed by Idaho (+10,000 head) and Texas (+8,000 head). California, Pennsylvania and Virginia experienced slight YOY reductions in milk cow herds.
U.S. milk production gains accelerated on a YOY basis throughout much of 2014, as shown below, however production growth tapered off over the final quarter of the year and into 2015. YOY production growth fell for the sixth consecutive month in Mar ’15 and remained at levels below the 2014 calendar year average YOY growth rate of 2.4%.
YOY production gains on a percentage basis were led by South Dakota (+9.6%), Michigan (+7.0%) and Kansas (+6.9%). California milk production declined YOY for the fourth consecutive month, finishing 2.9% lower, while production in New Mexico, Oregon and Texas also finished lower than the prior year. California, New Mexico, Oregon and Texas experienced lower YOY milk per cow yields while California also experienced a reduction in their milk cow herd.
Overall, the U.S. milk cow herd declined MOM for only the second time in the last 17 months in Mar ’15, with the number of milk cows on farms decreasing by 5,000 head vs. the Feb ’15 revised figure. The total milk cow herd stands at 9,301,000 head, which remains 78,000 head more than March of last year. Milk per cow yield was up 0.4% YOY, increasing to 1,941 lbs.
The vast majority of the MOM decline in the milk cow herd occurred in Texas (-5,000 head), while the milk cow herds in Utah (-1,000 head), Iowa (-1,000 head) and Virginia (-1,000 head) also declining. MOM increases in milk cow herds were experienced in South Dakota (+1,000 head), Kansas (+1,000 head) and New York (+1,000 head).
YOY increases in milk cow herds were led by Michigan (+22,000 head), followed by Idaho (+10,000 head) and Texas (+8,000 head). California, Pennsylvania and Virginia experienced slight YOY reductions in milk cow herds.