U.S. Per Capita Dairy Consumption Update – Feb ’20
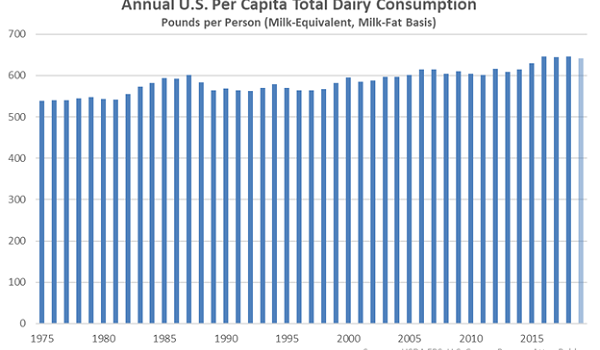
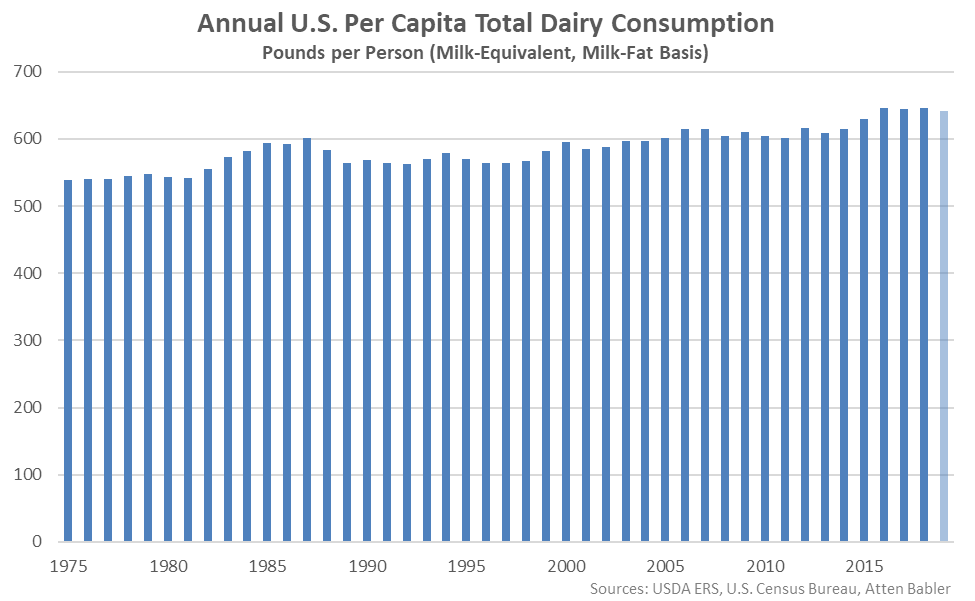
Domestic per capita consumption of dairy products on a milk-equivalent, milk-fat basis is projected to have declined 0.6% on a YOY basis throughout 2019, reaching a four year low level, overall. The YOY decline in consumption rates would be the largest experienced throughout the past six years on a percentage basis. Domestic per capita consumption of dairy products on a milk-equivalent, milk-fat basis reached a record high level throughout 2018, prior to the estimated declines experienced throughout 2019.
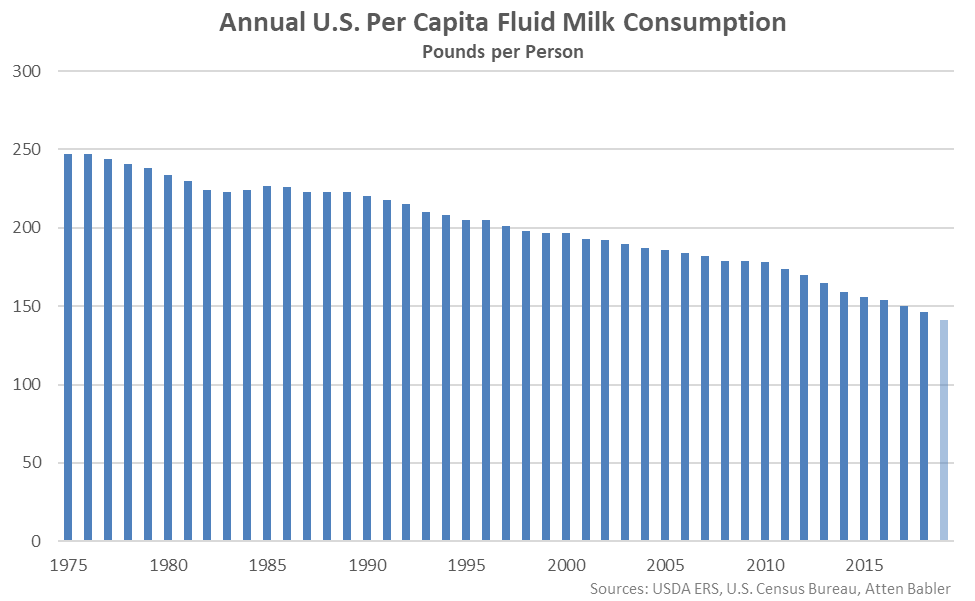
 Domestic per capita fluid milk consumption is on pace to reach the lowest level on record throughout 2019, declining by an estimated 3.2%. Fluid milk consumption declined to an estimated 141 pounds per person throughout 2019 based on fluid milk sales available through November, an estimated December figure based on recently experienced YOY changes in sales, and monthly population figures.
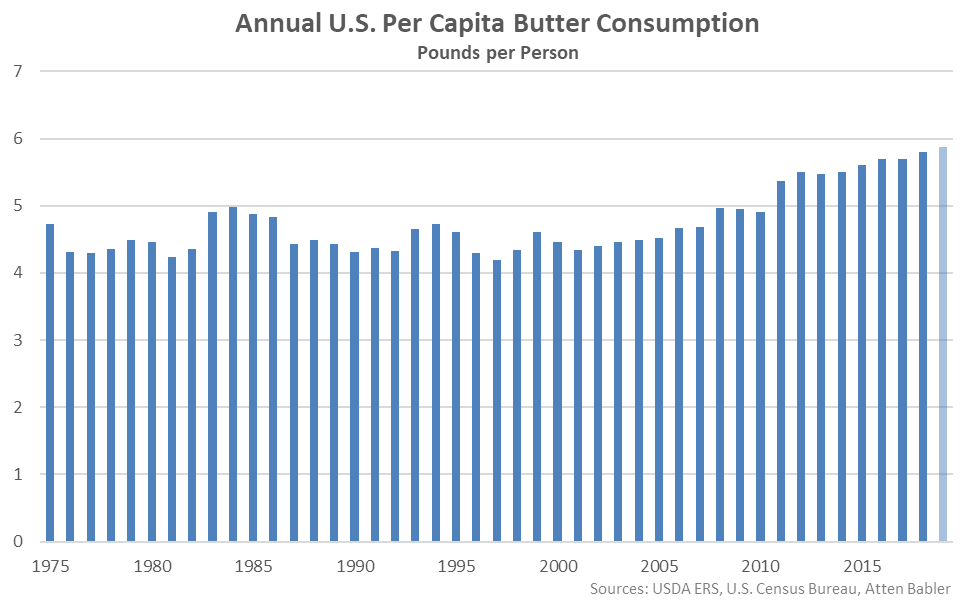
 Domestic per capita butter consumption reached a record high level throughout 2019, finishing 1.2% higher on a YOY basis. Butter consumption increased to 5.9 pounds per person throughout 2019 based on monthly commercial disappearance and population figures.
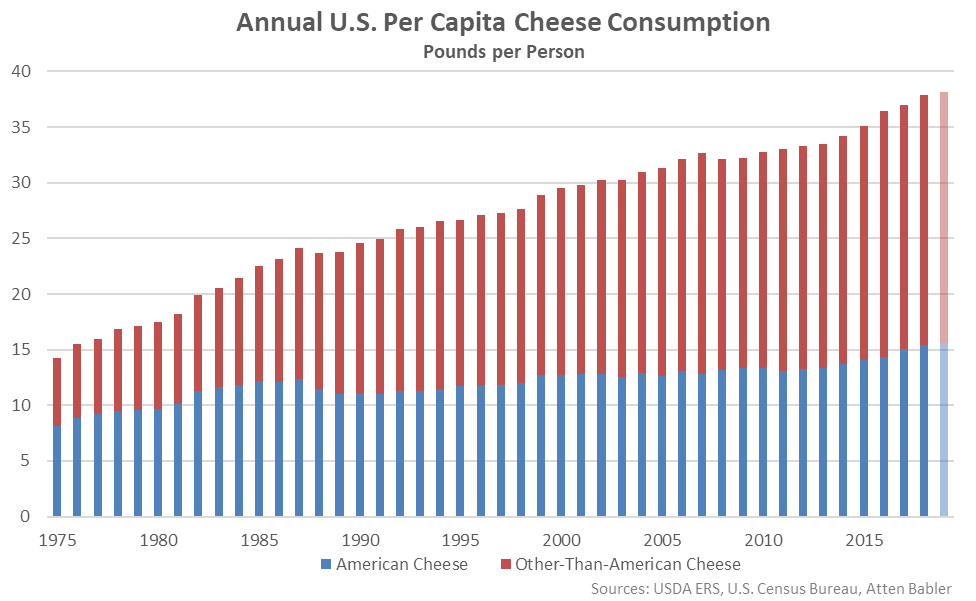
 Domestic per capita cheese consumption also reached a record high level throughout 2019, finishing 0.7% higher on a YOY basis. Cheese consumption increased to 38.1 pounds per person throughout 2019 based on monthly commercial disappearance and population figures. Per capita American cheese consumption increased by 0.5% on a YOY basis throughout 2019 while per capita other-than-American cheese increased by 0.7%.
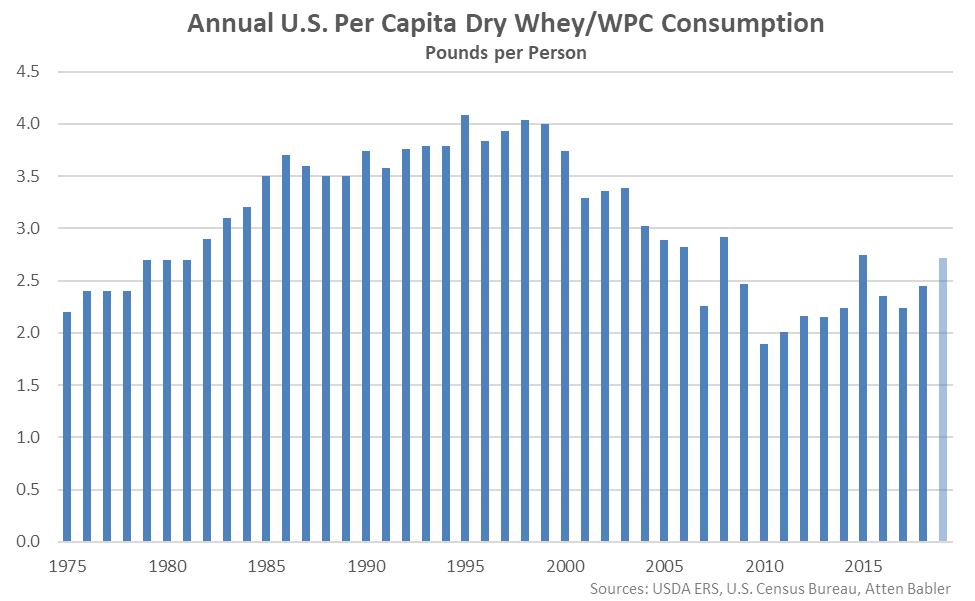
 Domestic per capita dry whey and whey protein concentrate consumption rebounded to a four year high level throughout 2019, finishing 10.8% higher on a YOY basis. Dry whey and whey protein concentrate consumption increased to 2.7 pounds per person throughout 2019 based on monthly commercial disappearance and population figures.
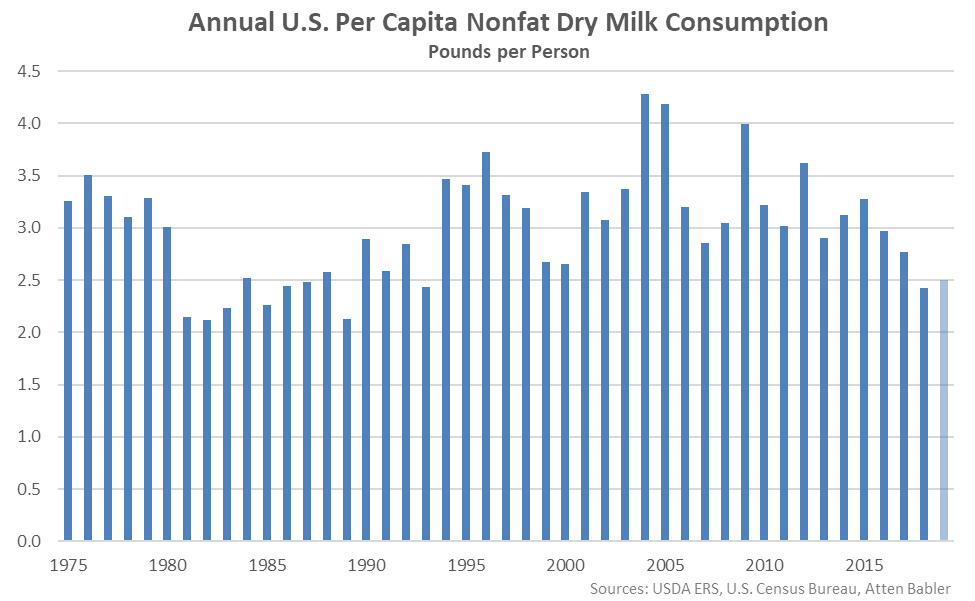
 2019 domestic per capita nonfat dry milk consumption rebounded 2.9% on a YOY basis from the 25 year low level experienced throughout the previous year but remained at the second lowest level experienced throughout the period. Nonfat dry milk consumption increased to 2.5 pounds per person throughout 2019 based on monthly commercial disappearance and population figures.
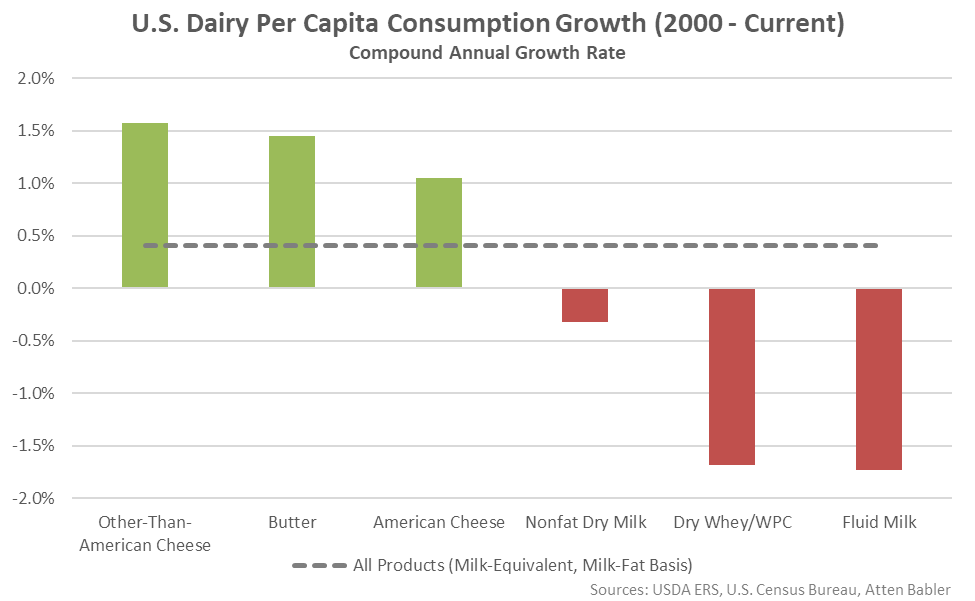
 Since 2000, total U.S. per capita consumption of dairy products on a milk-equivalent, milk-fat basis has increased by a compound annual growth rate of 0.4%. Per capita other-than-American cheese consumption increased most significantly throughout the period, followed closely by per capita butter consumption, while per capita fluid milk and dry whey/whey protein concentrate consumption have finished most significantly lower.
Domestic per capita fluid milk consumption is on pace to reach the lowest level on record throughout 2019, declining by an estimated 3.2%. Fluid milk consumption declined to an estimated 141 pounds per person throughout 2019 based on fluid milk sales available through November, an estimated December figure based on recently experienced YOY changes in sales, and monthly population figures.
Domestic per capita butter consumption reached a record high level throughout 2019, finishing 1.2% higher on a YOY basis. Butter consumption increased to 5.9 pounds per person throughout 2019 based on monthly commercial disappearance and population figures.
Domestic per capita cheese consumption also reached a record high level throughout 2019, finishing 0.7% higher on a YOY basis. Cheese consumption increased to 38.1 pounds per person throughout 2019 based on monthly commercial disappearance and population figures. Per capita American cheese consumption increased by 0.5% on a YOY basis throughout 2019 while per capita other-than-American cheese increased by 0.7%.
Domestic per capita dry whey and whey protein concentrate consumption rebounded to a four year high level throughout 2019, finishing 10.8% higher on a YOY basis. Dry whey and whey protein concentrate consumption increased to 2.7 pounds per person throughout 2019 based on monthly commercial disappearance and population figures.
2019 domestic per capita nonfat dry milk consumption rebounded 2.9% on a YOY basis from the 25 year low level experienced throughout the previous year but remained at the second lowest level experienced throughout the period. Nonfat dry milk consumption increased to 2.5 pounds per person throughout 2019 based on monthly commercial disappearance and population figures.
Since 2000, total U.S. per capita consumption of dairy products on a milk-equivalent, milk-fat basis has increased by a compound annual growth rate of 0.4%. Per capita other-than-American cheese consumption increased most significantly throughout the period, followed closely by per capita butter consumption, while per capita fluid milk and dry whey/whey protein concentrate consumption have finished most significantly lower.